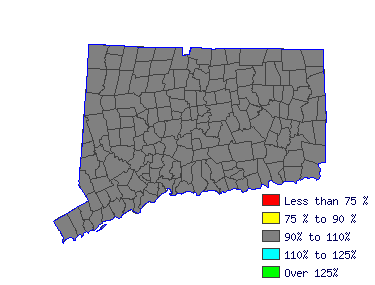
| South Central Workforce Investment Area (1Q 2015) |
| All Industry |
| Estimated employment | N/A |
| Mean wage | $72,724 |
| Entry wage | $43,382 |
| 10th percentile wage | $40,404 |
| 50th percentile wage | $69,219 |
| 90th percentile wage | $116,190 |
 | | Top Employing Industries |
| Industry | Employment | % |
| Education & Health Services |  | |
 |
| Best Paying Industries |
| Industry | Employment | Median
Wage |
| Education & Health Services |  | 72,724 |
 | |
 |
| Education Teachers, Postsecondary (25-1081) |
| Teach courses pertaining to education, such as counseling, curriculum, guidance, instruction, teacher education, and teaching English as a second language. Include both teachers primarily engaged in teaching and those who do a combination of both teaching and research. |
| Mean Wage History |
| Year | This Occupation | Compared to
Occupational Group | Difference |
| Current | $72723.87 | | $70028.74 |
| $2695.13 | | 2014 | $72370.27 | +.5% | $69688.24 |
+.5% | $2682.03 | | 2013 | $71014.80 | +1.9% | $68383.01 |
+1.9% | $2631.79 | | 2012 | $69659.33 | +1.9% | $67077.77 |
+1.9% | $2581.56 | | 2011 | $68303.86 | +2.0% | $65772.54 |
+2.0% | $2531.33 | | 2010 | $67243.06 | +1.6% | $64751.05 |
+1.6% | $2492.01 | | 2009 | $66064.39 | +1.8% | $63616.06 |
+1.8% | $2448.33 | | 2008 | $65357.19 | +1.1% | $62935.07 |
+1.1% | $2422.12 | | 2007 | $63412.39 | +3.1% | $61062.34 |
+3.1% | $2350.05 | | 2006 | $61290.78 | +3.5% | $59019.36 |
+3.5% | $2271.42 |
| Year | This Occupation | Compared to
All Occupations | Difference |
| Current | $72723.87 | | $54046.93 |
| $18676.94 | | 2014 | $72370.27 | +.5% | $53606.09 |
+.8% | $18764.18 | | 2013 | $71014.80 | +1.9% | $52459.91 |
+2.2% | $18554.89 | | 2012 | $69659.33 | +1.9% | $51401.89 |
+2.1% | $18257.44 | | 2011 | $68303.86 | +2.0% | $50520.21 |
+1.7% | $17783.65 | | 2010 | $67243.06 | +1.6% | $49726.70 |
+1.6% | $17516.36 | | 2009 | $66064.39 | +1.8% | $48889.11 |
+1.7% | $17175.28 | | 2008 | $65357.19 | +1.1% | $48227.85 |
+1.4% | $17129.34 | | 2007 | $63412.39 | +3.1% | $46993.50 |
+2.6% | $16418.89 | | 2006 | $61290.78 | +3.5% | $45494.64 |
+3.3% | $15796.14 |
|
Reference Date: 1st Quarter 2015 |
State of Connecticut Department of Labor Office of Research
200 Folly Brook Boulevard Wethersfield, CT 06109
Phone: 860-263-6285 |

| | | | |
| Top Areas For This Occupation |
|
|
|
 |
|


