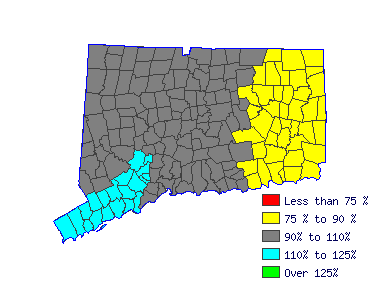
| Northwest Workforce Investment Area (1Q 2015) |
| All Industry |
| Estimated employment | 320 |
| Mean wage | 41.83 |
| Entry wage | 24.58 |
| 10th percentile wage | 22.22 |
| 50th percentile wage | 35.71 |
| 90th percentile wage | 61.78 |
 |
| Top Employing Industries |
| Industry | Employment | % |
| Trade, Transportation & Utilities | 200 | 63.3% |
| Financial Activities | 50 | 16.2% |
| Professional & Business Services | 30 | 8.0% |
| Manufacturing | 20 | 6.8% |
| Information | 20 | 4.8% |
 |
| Best Paying Industries |
| Industry | Employment | Median
Wage |
| Financial Activities | 50 | 56.23 |
| Trade, Transportation & Utilities | 200 | 40.59 |
| Manufacturing | 20 | 35.27 |
| Professional & Business Services | 30 | 34.96 |
| Information | 20 | 31.32 |
 |


