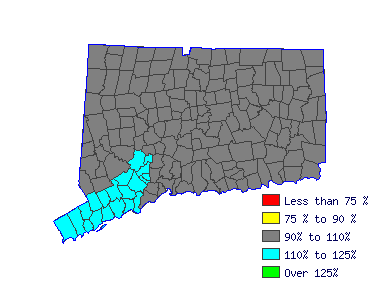
| Northwest Workforce Investment Area (1Q 2015) |
| All Industry |
| Estimated employment | 2,430 |
| Mean wage | $67,090 |
| Entry wage | $45,110 |
| 10th percentile wage | $40,647 |
| 50th percentile wage | $66,841 |
| 90th percentile wage | $95,077 |
 | | Top Employing Industries |
| Industry | Employment | % |
| Education & Health Services | 2,430 | 100.0% |
 |
| Best Paying Industries |
| Industry | Employment | Median
Wage |
| Education & Health Services | 2,430 | 67,090 |
 | |
 |
| Secondary School Teachers, Ex. Special and Career/Technical Ed (25-2031) |
| Teach students in one or more subjects, such as English, mathematics, or social studies at the secondary level in public or private schools. May be designated according to subject matter specialty. Substitute teachers are included in ""Teachers and Ins |
| Mean Wage History |
| Year | This Occupation | Compared to
Occupational Group | Difference |
| Current | $67090.26 | | $55367.76 |
| $11722.50 | | 2014 | $66764.05 | +.5% | $55098.55 |
+.5% | $11665.50 | | 2013 | $65513.58 | +1.9% | $54066.57 |
+1.9% | $11447.01 | | 2012 | $64263.12 | +1.9% | $53034.60 |
+1.9% | $11228.52 | | 2011 | $63012.65 | +2.0% | $52002.62 |
+2.0% | $11010.03 | | 2010 | $62034.02 | +1.6% | $51194.99 |
+1.6% | $10839.04 | | 2009 | $60946.66 | +1.8% | $50297.62 |
+1.8% | $10649.05 | | 2008 | $60294.25 | +1.1% | $49759.19 |
+1.1% | $10535.05 | | 2007 | $58500.10 | +3.1% | $48278.53 |
+3.1% | $10221.56 | | 2006 | $56542.84 | +3.5% | $46663.27 |
+3.5% | $9879.58 |
| Year | This Occupation | Compared to
All Occupations | Difference |
| Current | $67090.26 | | $50965.12 |
| $16125.14 | | 2014 | $66764.05 | +.5% | $50549.42 |
+.8% | $16214.63 | | 2013 | $65513.58 | +1.9% | $49468.59 |
+2.2% | $16044.99 | | 2012 | $64263.12 | +1.9% | $48470.91 |
+2.1% | $15792.21 | | 2011 | $63012.65 | +2.0% | $47639.50 |
+1.7% | $15373.15 | | 2010 | $62034.02 | +1.6% | $46891.24 |
+1.6% | $15142.79 | | 2009 | $60946.66 | +1.8% | $46101.40 |
+1.7% | $14845.26 | | 2008 | $60294.25 | +1.1% | $45477.85 |
+1.4% | $14816.40 | | 2007 | $58500.10 | +3.1% | $44313.88 |
+2.6% | $14186.22 | | 2006 | $56542.84 | +3.5% | $42900.49 |
+3.3% | $13642.35 |
|
Reference Date: 1st Quarter 2015 |
State of Connecticut Department of Labor Office of Research
200 Folly Brook Boulevard Wethersfield, CT 06109
Phone: 860-263-6285 |

| | | | |
| Top Areas For This Occupation |
| Best Pay |
| Southwest |
75,331 |
3,380 |
| South Central |
72,283 |
2,680 |
| North Central |
71,568 |
4,330 |
| Northwest |
67,090 |
2,430 |
| Eastern |
66,605 |
1,770 |
|
| Highest Employment |
| North Central |
71,568 |
4,330 |
| Southwest |
75,331 |
3,380 |
| South Central |
72,283 |
2,680 |
| Northwest |
67,090 |
2,430 |
| Eastern |
66,605 |
1,770 |
|
|
 |
|


