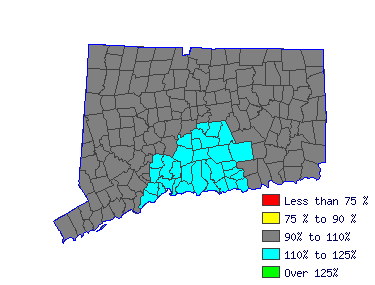
| Northwest Workforce Investment Area (1Q 2015) |
| All Industry |
| Estimated employment | 370 |
| Mean wage | $67,782 |
| Entry wage | $49,767 |
| 10th percentile wage | $47,259 |
| 50th percentile wage | $66,586 |
| 90th percentile wage | $93,539 |
 | | Top Employing Industries |
| Industry | Employment | % |
| Education & Health Services | 370 | 100.0% |
 |
| Best Paying Industries |
| Industry | Employment | Median
Wage |
| Education & Health Services | 370 | 67,782 |
 | |
 |
| Kindergarten Teachers, Ex. Special Education (25-2012) |
| Teach elemental natural and social science, personal hygiene, music, art, and literature to children from 4 to 6 years old. Promote physical, mental, and social development. May be required to hold State certification. Exclude "Special Education Teachers" (25-2041 through 25-2043). |
| Mean Wage History |
| Year | This Occupation | Compared to
Occupational Group | Difference |
| Current | $67781.78 | | $55367.76 |
| $12414.02 | | 2014 | $67452.21 | +.5% | $55098.55 |
+.5% | $12353.66 | | 2013 | $66188.85 | +1.9% | $54066.57 |
+1.9% | $12122.28 | | 2012 | $64925.50 | +1.9% | $53034.60 |
+1.9% | $11890.90 | | 2011 | $63662.14 | +2.0% | $52002.62 |
+2.0% | $11659.52 | | 2010 | $62673.43 | +1.6% | $51194.99 |
+1.6% | $11478.44 | | 2009 | $61574.86 | +1.8% | $50297.62 |
+1.8% | $11277.24 | | 2008 | $60915.72 | +1.1% | $49759.19 |
+1.1% | $11156.52 | | 2007 | $59103.08 | +3.1% | $48278.53 |
+3.1% | $10824.54 | | 2006 | $57125.65 | +3.5% | $46663.27 |
+3.5% | $10462.38 |
| Year | This Occupation | Compared to
All Occupations | Difference |
| Current | $67781.78 | | $50965.12 |
| $16816.66 | | 2014 | $67452.21 | +.5% | $50549.42 |
+.8% | $16902.79 | | 2013 | $66188.85 | +1.9% | $49468.59 |
+2.2% | $16720.26 | | 2012 | $64925.50 | +1.9% | $48470.91 |
+2.1% | $16454.59 | | 2011 | $63662.14 | +2.0% | $47639.50 |
+1.7% | $16022.64 | | 2010 | $62673.43 | +1.6% | $46891.24 |
+1.6% | $15782.19 | | 2009 | $61574.86 | +1.8% | $46101.40 |
+1.7% | $15473.46 | | 2008 | $60915.72 | +1.1% | $45477.85 |
+1.4% | $15437.87 | | 2007 | $59103.08 | +3.1% | $44313.88 |
+2.6% | $14789.19 | | 2006 | $57125.65 | +3.5% | $42900.49 |
+3.3% | $14225.16 |
|
Reference Date: 1st Quarter 2015 |
State of Connecticut Department of Labor Office of Research
200 Folly Brook Boulevard Wethersfield, CT 06109
Phone: 860-263-6285 |

| | | | |
| Top Areas For This Occupation |
|
|
|
 |
|


