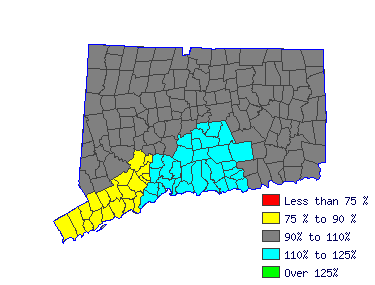
| Mean Wage History |
| Year | This Occupation | Compared to
Occupational Group | Difference |
| Current | $76933.87 | | $55367.76 |
| $21566.11 |
| 2014 | $76559.80 | +.5% | $55098.55 |
+.5% | $21461.25 |
| 2013 | $75125.86 | +1.9% | $54066.57 |
+1.9% | $21059.29 |
| 2012 | $73691.92 | +1.9% | $53034.60 |
+1.9% | $20657.33 |
| 2011 | $72257.99 | +2.0% | $52002.62 |
+2.0% | $20255.37 |
| 2010 | $71135.77 | +1.6% | $51194.99 |
+1.6% | $19940.79 |
| 2009 | $69888.87 | +1.8% | $50297.62 |
+1.8% | $19591.26 |
| 2008 | $69140.73 | +1.1% | $49759.19 |
+1.1% | $19381.54 |
| 2007 | $67083.34 | +3.1% | $48278.53 |
+3.1% | $18804.81 |
| 2006 | $64838.92 | +3.5% | $46663.27 |
+3.5% | $18175.65 |
| Year | This Occupation | Compared to
All Occupations | Difference |
| Current | $76933.87 | | $50965.12 |
| $25968.75 |
| 2014 | $76559.80 | +.5% | $50549.42 |
+.8% | $26010.38 |
| 2013 | $75125.86 | +1.9% | $49468.59 |
+2.2% | $25657.27 |
| 2012 | $73691.92 | +1.9% | $48470.91 |
+2.1% | $25221.02 |
| 2011 | $72257.99 | +2.0% | $47639.50 |
+1.7% | $24618.49 |
| 2010 | $71135.77 | +1.6% | $46891.24 |
+1.6% | $24244.54 |
| 2009 | $69888.87 | +1.8% | $46101.40 |
+1.7% | $23787.47 |
| 2008 | $69140.73 | +1.1% | $45477.85 |
+1.4% | $23662.88 |
| 2007 | $67083.34 | +3.1% | $44313.88 |
+2.6% | $22769.46 |
| 2006 | $64838.92 | +3.5% | $42900.49 |
+3.3% | $21938.43 |
|
Reference Date: 1st Quarter 2015 |
State of Connecticut Department of Labor Office of Research
200 Folly Brook Boulevard Wethersfield, CT 06109
Phone: 860-263-6285 |

| | | | |
| Top Areas For This Occupation |
|
|
|
 |


