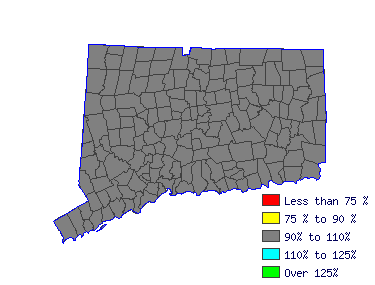
| North Central WDA (1Q 2016) |
| All Industry |
| Estimated employment | 4,980 |
| Mean wage | $75,202 |
| Entry wage | $51,060 |
| 10th percentile wage | $46,766 |
| 50th percentile wage | $77,333 |
| 90th percentile wage | $101,667 |
 | | Top Employing Industries |
| Industry | Employment / Percent |
| Education and Health Services | 4,980 | 100% |
 |
| Top Paying Industries |
| Industry | Employment / Median Wage |
| Education and Health Services | 4,980 | $77,333 |
 | |
 |
| Elementary School Teachers, Ex. Special Education (25-2021) |
| Teach pupils in public or private schools at the elementary level basic academic, social, and other formative skills. Exclude "Special Education Teachers" (25-2041 through 25-2043). |
 |
| Mean Wage History |
| Year | This
Occupation | Compared to
Occupational Group | Difference |
| Current | $77332.75 | | $55535.36 |
| $21797.39 | | 2015 | $75368.74 | +2.6% | $54124.94 |
+2.6% | $21243.81 | | 2014 | $73957.11 | +1.9% | $53111.20 |
+1.9% | $20845.92 | | 2013 | $72545.48 | +1.9% | $52097.46 |
+1.9% | $20448.03 | | 2012 | $71133.85 | +2.0% | $51083.72 |
+2.0% | $20050.14 | | 2011 | $70029.10 | +1.6% | $50290.35 |
+1.6% | $19738.75 | | 2010 | $68801.60 | +1.8% | $49408.84 |
+1.8% | $19392.76 | | 2009 | $68065.10 | +1.1% | $48879.93 |
+1.1% | $19185.16 | | 2008 | $66039.71 | +3.1% | $47425.43 |
+3.1% | $18614.28 | | 2007 | $63830.21 | +3.5% | $45838.71 |
+3.5% | $17991.50 |
| Year | This
Occupation | Compared to
All Occupations | Difference |
| Current | $77332.75 | | $45452.32 |
| $31880.43 | | 2015 | $75368.74 | +2.6% | $44180.67 |
+2.9% | $31188.07 | | 2014 | $73957.11 | +1.9% | $43236.02 |
+2.2% | $30721.09 | | 2013 | $72545.48 | +1.9% | $42364.03 |
+2.1% | $30181.45 | | 2012 | $71133.85 | +2.0% | $41637.38 |
+1.7% | $29496.48 | | 2011 | $70029.10 | +1.6% | $40983.39 |
+1.6% | $29045.71 | | 2010 | $68801.60 | +1.8% | $40293.06 |
+1.7% | $28508.53 | | 2009 | $68065.10 | +1.1% | $39748.07 |
+1.4% | $28317.02 | | 2008 | $66039.71 | +3.1% | $38730.75 |
+2.6% | $27308.96 | | 2007 | $63830.21 | +3.5% | $37495.44 |
+3.3% | $26334.77 |
 |
|
| Reference Date: 1st Quarter 2016 |
| Top Areas For This Occupation |
| Best Pay |
|
| Southwest |
$81,394 |
4,590 |
| Northwest |
$77,536 |
3,130 |
| North Central |
$77,333 |
4,980 |
| South Central |
$73,380 |
3,560 |
| Eastern |
$71,728 |
1,840 |
|
| Highest Employment |
|
| North Central |
$77,333 |
4,980 |
| Southwest |
$81,394 |
4,590 |
| South Central |
$73,380 |
3,560 |
| Northwest |
$77,536 |
3,130 |
| Eastern |
$71,728 |
1,840 |
|
|

| |


