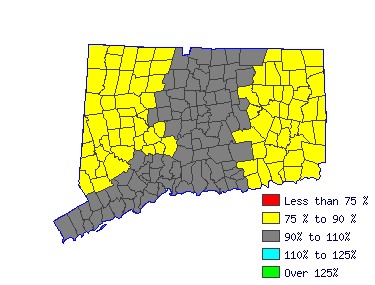
| Control and extinguish fires or respond to emergency situations where life, property, or the environment is at risk. Duties may include fire prevention, emergency medical service, hazardous material response, search and rescue, and disaster assistance. |
 |
| Mean Wage History |
| Year | This
Occupation | Compared to
Occupational Group | Difference |
| Current | $32.92 | | $27.20 |
| $5.72 |
| 2015 | $32.04 | +2.7% | $26.48 |
+2.7% | $5.57 |
| 2014 | $31.41 | +2.0% | $25.95 |
+2.0% | $5.46 |
| 2013 | $31.01 | +1.3% | $25.62 |
+1.3% | $5.39 |
| 2012 | $30.56 | +1.5% | $25.25 |
+1.5% | $5.31 |
| 2011 | $30.13 | +1.4% | $24.90 |
+1.4% | $5.24 |
| 2010 | $29.81 | +1.1% | $24.63 |
+1.1% | $5.18 |
| 2009 | $29.23 | +2.0% | $24.15 |
+2.0% | $5.08 |
| 2008 | $28.43 | +2.8% | $23.49 |
+2.8% | $4.94 |
| 2007 | $27.32 | +4.1% | $22.57 |
+4.1% | $4.75 |
| Year | This
Occupation | Compared to
All Occupations | Difference |
| Current | $32.92 | | $20.85 |
| $12.07 |
| 2015 | $32.04 | +2.7% | $20.27 |
+2.9% | $11.78 |
| 2014 | $31.41 | +2.0% | $19.83 |
+2.2% | $11.57 |
| 2013 | $31.01 | +1.3% | $19.43 |
+2.1% | $11.58 |
| 2012 | $30.56 | +1.5% | $19.10 |
+1.7% | $11.46 |
| 2011 | $30.13 | +1.4% | $18.80 |
+1.6% | $11.33 |
| 2010 | $29.81 | +1.1% | $18.48 |
+1.7% | $11.33 |
| 2009 | $29.23 | +2.0% | $18.23 |
+1.4% | $11.00 |
| 2008 | $28.43 | +2.8% | $17.77 |
+2.6% | $10.67 |
| 2007 | $27.32 | +4.1% | $17.20 |
+3.3% | $10.12 |
 |
|
| Reference Date: 1st Quarter 2016 |


