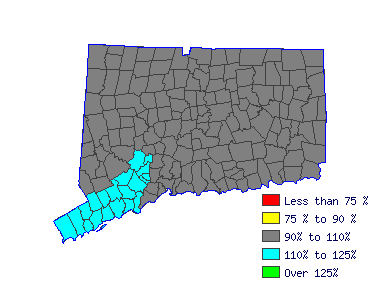
South Central WDA (1Q 2016) |
All Industry |
Estimated employment | 338,910 |
Mean wage | $26.21 |
Entry wage | $11.59 |
10th percentile wage | $9.83 |
50th percentile wage | $20.85 |
90th percentile wage | $47.09 |
 | Top Employing Industries |
Industry | Employment / Percent |
Education and Health Services | 112,060 | 33.1% |
Trade, Transportation and Utilities | 63,710 | 18.8% |
Professional and Business Services | 38,530 | 11.4% |
Leisure and Hospitality | 31,700 | 9.4% |
Manufacturing | 31,180 | 9.2% |
 |
Top Paying Industries |
Industry | Employment / Median Wage |
Public Administration | 17,160 | $29.46 |
Information | 4,580 | $27.94 |
Construction | 13,240 | $26.99 |
Financial Activities | 15,910 | $25.56 |
Education and Health Services | 112,060 | $24.63 |
 | |
 |
Total all occupations (00-0000) |
|
 |
Mean Wage History |
Year | This Occupation | Compared to Occupational Group | Difference |
Current | $20.85 | | $20.85 |
| $0.00 | 2015 | $20.27 | +2.9% | $20.27 |
+2.9% | $0.00 | 2014 | $19.83 | +2.2% | $19.83 |
+2.2% | $0.00 | 2013 | $19.43 | +2.1% | $19.43 |
+2.1% | $0.00 | 2012 | $19.10 | +1.7% | $19.10 |
+1.7% | $0.00 | 2011 | $18.80 | +1.6% | $18.80 |
+1.6% | $0.00 | 2010 | $18.48 | +1.7% | $18.48 |
+1.7% | $0.00 | 2009 | $18.23 | +1.4% | $18.23 |
+1.4% | $0.00 | 2008 | $17.77 | +2.6% | $17.77 |
+2.6% | $0.00 | 2007 | $17.20 | +3.3% | $17.20 |
+3.3% | $0.00 |
Year | This Occupation | Compared to All Occupations | Difference |
Current | $20.85 | | $20.85 |
| $0.00 | 2015 | $20.27 | +2.9% | $20.27 |
+2.9% | $0.00 | 2014 | $19.83 | +2.2% | $19.83 |
+2.2% | $0.00 | 2013 | $19.43 | +2.1% | $19.43 |
+2.1% | $0.00 | 2012 | $19.10 | +1.7% | $19.10 |
+1.7% | $0.00 | 2011 | $18.80 | +1.6% | $18.80 |
+1.6% | $0.00 | 2010 | $18.48 | +1.7% | $18.48 |
+1.7% | $0.00 | 2009 | $18.23 | +1.4% | $18.23 |
+1.4% | $0.00 | 2008 | $17.77 | +2.6% | $17.77 |
+2.6% | $0.00 | 2007 | $17.20 | +3.3% | $17.20 |
+3.3% | $0.00 |
 |
Reference Date: 1st Quarter 2016 |
|
Top Areas For This Occupation |
|
|
|