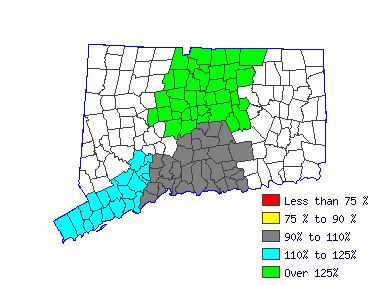
| Create special effects, animation, or other visual images using film, video, computers, or other electronic tools and media for use in products or creations, such as computer games, movies, music videos, and commercials. |
 |
| Mean Wage History |
| Year | This
Occupation | Compared to
Occupational Group | Difference |
| Current | $28.91 | | $22.91 |
| $6.00 |
| 2015 | $28.18 | +2.6% | $22.33 |
+2.6% | $5.85 |
| 2014 | $27.65 | +1.9% | $21.91 |
+1.9% | $5.74 |
| 2013 | $27.12 | +1.9% | $21.49 |
+1.9% | $5.63 |
| 2012 | $26.59 | +2.0% | $21.07 |
+2.0% | $5.52 |
| 2011 | $26.18 | +1.6% | $20.75 |
+1.6% | $5.43 |
| 2010 | $25.72 | +1.8% | $20.38 |
+1.8% | $5.34 |
| 2009 | $25.45 | +1.1% | $20.16 |
+1.1% | $5.28 |
| 2008 | $24.69 | +3.1% | $19.56 |
+3.1% | $5.12 |
| 2007 | $23.86 | +3.5% | $18.91 |
+3.5% | $4.95 |
| Year | This
Occupation | Compared to
All Occupations | Difference |
| Current | $28.91 | | $20.85 |
| $8.06 |
| 2015 | $28.18 | +2.6% | $20.27 |
+2.9% | $7.91 |
| 2014 | $27.65 | +1.9% | $19.83 |
+2.2% | $7.81 |
| 2013 | $27.12 | +1.9% | $19.43 |
+2.1% | $7.69 |
| 2012 | $26.59 | +2.0% | $19.10 |
+1.7% | $7.49 |
| 2011 | $26.18 | +1.6% | $18.80 |
+1.6% | $7.38 |
| 2010 | $25.72 | +1.8% | $18.48 |
+1.7% | $7.24 |
| 2009 | $25.45 | +1.1% | $18.23 |
+1.4% | $7.21 |
| 2008 | $24.69 | +3.1% | $17.77 |
+2.6% | $6.92 |
| 2007 | $23.86 | +3.5% | $17.20 |
+3.3% | $6.66 |
 |
|
| Reference Date: 1st Quarter 2016 |


