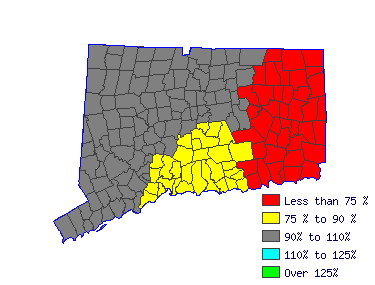
| Set up, operate, or tend paper goods machines that perform a variety of functions, such as converting, sawing, corrugating, banding, wrapping, boxing, stitching, forming, or sealing paper or paperboard sheets into products. |
 |
| Mean Wage History |
| Year | This
Occupation | Compared to
Occupational Group | Difference |
| Current | $21.78 | | $19.17 |
| $2.61 |
| 2015 | $21.09 | +3.3% | $18.56 |
+3.3% | $2.53 |
| 2014 | $20.61 | +2.3% | $18.14 |
+2.3% | $2.47 |
| 2013 | $20.22 | +1.9% | $17.80 |
+1.9% | $2.42 |
| 2012 | $19.89 | +1.7% | $17.50 |
+1.7% | $2.38 |
| 2011 | $19.57 | +1.6% | $17.22 |
+1.6% | $2.34 |
| 2010 | $19.35 | +1.1% | $17.03 |
+1.1% | $2.32 |
| 2009 | $19.02 | +1.8% | $16.74 |
+1.8% | $2.28 |
| 2008 | $18.52 | +2.7% | $16.30 |
+2.7% | $2.22 |
| 2007 | $18.10 | +2.3% | $15.93 |
+2.3% | $2.17 |
| Year | This
Occupation | Compared to
All Occupations | Difference |
| Current | $21.78 | | $23.35 |
| -$1.57 |
| 2015 | $21.09 | +3.3% | $22.70 |
+2.9% | -$1.60 |
| 2014 | $20.61 | +2.3% | $22.21 |
+2.2% | -$1.60 |
| 2013 | $20.22 | +1.9% | $21.76 |
+2.1% | -$1.54 |
| 2012 | $19.89 | +1.7% | $21.39 |
+1.7% | -$1.50 |
| 2011 | $19.57 | +1.6% | $21.05 |
+1.6% | -$1.48 |
| 2010 | $19.35 | +1.1% | $20.70 |
+1.7% | -$1.34 |
| 2009 | $19.02 | +1.8% | $20.42 |
+1.4% | -$1.40 |
| 2008 | $18.52 | +2.7% | $19.90 |
+2.6% | -$1.37 |
| 2007 | $18.10 | +2.3% | $19.26 |
+3.3% | -$1.16 |
 |
|
| Reference Date: 1st Quarter 2016 |


