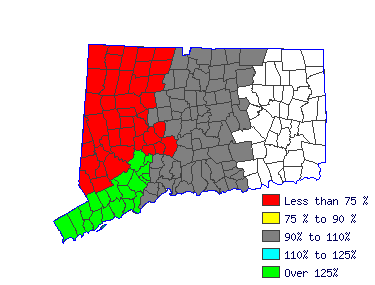
| South Central WDA (1Q 2016) |
| All Industry |
| Estimated employment | N/A |
| Mean wage | $36,025 |
| Entry wage | $22,108 |
| 10th percentile wage | $19,673 |
| 50th percentile wage | $34,804 |
| 90th percentile wage | $58,266 |
 | | Top Employing Industries |
| Industry | Employment / Percent |
| Education and Health Services | | |
 |
| Top Paying Industries |
| Industry | Employment / Median Wage |
| Education and Health Services | | $34,804 |
 | |
 |
| Graduate Teaching Assistants (25-1191) |
| Assist department chairperson, faculty members, or other professional staff members in college or university by performing teaching or teaching-related duties, such as teaching lower level courses, developing teaching materials, preparing and giving examinations, and grading examinations or papers. Graduate assistants must be enrolled in a graduate school program. Graduate assistants who primarily perform non-teaching duties, such as laboratory research, should be reported in the occupational category related to the work performed. |
 |
| Mean Wage History |
| Year | This
Occupation | Compared to
Occupational Group | Difference |
| Current | $34804.20 | | $59532.46 |
| -$24728.26 | | 2015 | $33920.28 | +2.6% | $58020.52 |
+2.6% | -$24100.24 | | 2014 | $33284.97 | +1.9% | $56933.82 |
+1.9% | -$23648.85 | | 2013 | $32649.65 | +1.9% | $55847.12 |
+1.9% | -$23197.46 | | 2012 | $32014.34 | +2.0% | $54760.41 |
+2.0% | -$22746.07 | | 2011 | $31517.14 | +1.6% | $53909.95 |
+1.6% | -$22392.81 | | 2010 | $30964.69 | +1.8% | $52964.99 |
+1.8% | -$22000.30 | | 2009 | $30633.22 | +1.1% | $52398.01 |
+1.1% | -$21764.79 | | 2008 | $29721.68 | +3.1% | $50838.83 |
+3.1% | -$21117.14 | | 2007 | $28727.28 | +3.5% | $49137.90 |
+3.5% | -$20410.62 |
| Year | This
Occupation | Compared to
All Occupations | Difference |
| Current | $34804.20 | | $43353.41 |
| -$8549.21 | | 2015 | $33920.28 | +2.6% | $42140.48 |
+2.9% | -$8220.20 | | 2014 | $33284.97 | +1.9% | $41239.45 |
+2.2% | -$7954.48 | | 2013 | $32649.65 | +1.9% | $40407.73 |
+2.1% | -$7758.08 | | 2012 | $32014.34 | +2.0% | $39714.63 |
+1.7% | -$7700.29 | | 2011 | $31517.14 | +1.6% | $39090.84 |
+1.6% | -$7573.70 | | 2010 | $30964.69 | +1.8% | $38432.40 |
+1.7% | -$7467.71 | | 2009 | $30633.22 | +1.1% | $37912.57 |
+1.4% | -$7279.35 | | 2008 | $29721.68 | +3.1% | $36942.23 |
+2.6% | -$7220.55 | | 2007 | $28727.28 | +3.5% | $35763.96 |
+3.3% | -$7036.68 |
 |
|
| Reference Date: 1st Quarter 2016 |
| Top Areas For This Occupation |
|
|
|

| |


