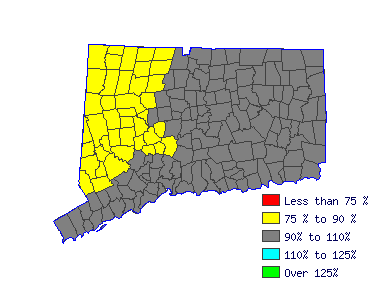
North Central WDA (1Q 2016) |
All Industry |
Estimated employment | 130 |
Mean wage | $37.20 |
Entry wage | $27.72 |
10th percentile wage | $23.04 |
50th percentile wage | $36.71 |
90th percentile wage | $49.98 |
 | Top Employing Industries |
Industry | Employment / Percent |
Public Administration | 40 | 29% |
Manufacturing | 20 | 18.2% |
Professional and Business Services | 20 | 17.4% |
Trade, Transportation and Utilities | 20 | 14.9% |
Education and Health Services | 10 | 10.2% |
 |
Top Paying Industries |
Industry | Employment / Median Wage |
Public Administration | 40 | $37.73 |
Education and Health Services | 10 | $37.53 |
Manufacturing | 20 | $36.50 |
Trade, Transportation and Utilities | 20 | $35.52 |
Professional and Business Services | 20 | $28.50 |
 | |
 |
Occupational Health and Safety Specialists (29-9011) |
Review, evaluate, and analyze work environments and design programs and procedures to control, eliminate, and prevent disease or injury caused by chemical, physical, and biological agents or ergonomic factors. May conduct inspections and enforce adherence to laws and regulations governing the health and safety of individuals. May be employed in the public or private sector. Include environmental protection officers. |
 |
Mean Wage History |
Year | This Occupation | Compared to Occupational Group | Difference |
Current | $36.71 | | $36.07 |
| $0.64 | 2015 | $35.78 | +2.6% | $35.15 |
+2.6% | $0.62 | 2014 | $35.11 | +1.9% | $34.50 |
+1.9% | $0.61 | 2013 | $34.44 | +1.9% | $33.84 |
+1.9% | $0.60 | 2012 | $33.77 | +2.0% | $33.18 |
+2.0% | $0.59 | 2011 | $33.24 | +1.6% | $32.66 |
+1.6% | $0.58 | 2010 | $32.66 | +1.8% | $32.09 |
+1.8% | $0.57 | 2009 | $32.31 | +1.1% | $31.75 |
+1.1% | $0.56 | 2008 | $31.35 | +3.1% | $30.80 |
+3.1% | $0.55 | 2007 | $30.30 | +3.5% | $29.77 |
+3.5% | $0.53 |
Year | This Occupation | Compared to All Occupations | Difference |
Current | $36.71 | | $21.85 |
| $14.86 | 2015 | $35.78 | +2.6% | $21.24 |
+2.9% | $14.54 | 2014 | $35.11 | +1.9% | $20.78 |
+2.2% | $14.32 | 2013 | $34.44 | +1.9% | $20.37 |
+2.1% | $14.07 | 2012 | $33.77 | +2.0% | $20.02 |
+1.7% | $13.75 | 2011 | $33.24 | +1.6% | $19.70 |
+1.6% | $13.54 | 2010 | $32.66 | +1.8% | $19.37 |
+1.7% | $13.29 | 2009 | $32.31 | +1.1% | $19.11 |
+1.4% | $13.20 | 2008 | $31.35 | +3.1% | $18.62 |
+2.6% | $12.73 | 2007 | $30.30 | +3.5% | $18.02 |
+3.3% | $12.28 |
 |
Reference Date: 1st Quarter 2016 |
|