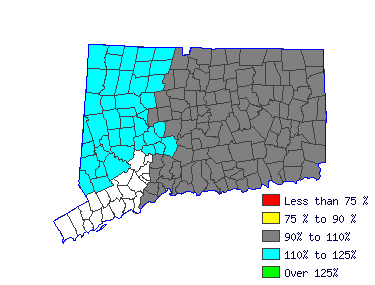
| Set up, operate, or tend heating equipment, such as heat-treating furnaces, flame-hardening machines, induction machines, soaking pits, or vacuum equipment to temper, harden, anneal, or heat-treat metal or plastic objects. |
 |
| Mean Wage History |
| Year | This
Occupation | Compared to
Occupational Group | Difference |
| Current | $17.84 | | $20.50 |
| -$2.66 |
| 2015 | $17.27 | +3.3% | $19.85 |
+3.3% | -$2.57 |
| 2014 | $16.88 | +2.3% | $19.40 |
+2.3% | -$2.51 |
| 2013 | $16.56 | +1.9% | $19.03 |
+1.9% | -$2.46 |
| 2012 | $16.29 | +1.7% | $18.72 |
+1.7% | -$2.42 |
| 2011 | $16.03 | +1.6% | $18.42 |
+1.6% | -$2.38 |
| 2010 | $15.85 | +1.1% | $18.22 |
+1.1% | -$2.36 |
| 2009 | $15.58 | +1.8% | $17.90 |
+1.8% | -$2.32 |
| 2008 | $15.17 | +2.7% | $17.43 |
+2.7% | -$2.26 |
| 2007 | $14.82 | +2.3% | $17.03 |
+2.3% | -$2.21 |
| Year | This
Occupation | Compared to
All Occupations | Difference |
| Current | $17.84 | | $20.53 |
| -$2.69 |
| 2015 | $17.27 | +3.3% | $19.96 |
+2.9% | -$2.68 |
| 2014 | $16.88 | +2.3% | $19.53 |
+2.2% | -$2.64 |
| 2013 | $16.56 | +1.9% | $19.14 |
+2.1% | -$2.57 |
| 2012 | $16.29 | +1.7% | $18.81 |
+1.7% | -$2.51 |
| 2011 | $16.03 | +1.6% | $18.51 |
+1.6% | -$2.48 |
| 2010 | $15.85 | +1.1% | $18.20 |
+1.7% | -$2.34 |
| 2009 | $15.58 | +1.8% | $17.95 |
+1.4% | -$2.37 |
| 2008 | $15.17 | +2.7% | $17.49 |
+2.6% | -$2.32 |
| 2007 | $14.82 | +2.3% | $16.94 |
+3.3% | -$2.11 |
 |
|
| Reference Date: 1st Quarter 2016 |


