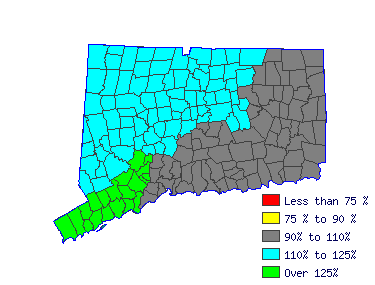
 |
| Mean Wage History |
| Year | This
Occupation | Compared to
Occupational Group | Difference |
| Current | $19.97 | | $11.77 |
| $8.20 |
| 2015 | $19.71 | +1.3% | $11.61 |
+1.3% | $8.09 |
| 2014 | $19.14 | +2.9% | $11.28 |
+2.9% | $7.86 |
| 2013 | $18.68 | +2.5% | $11.01 |
+2.5% | $7.67 |
| 2012 | $18.30 | +2.1% | $10.79 |
+2.1% | $7.52 |
| 2011 | $17.94 | +2.0% | $10.57 |
+2.0% | $7.37 |
| 2010 | $17.53 | +2.4% | $10.33 |
+2.4% | $7.20 |
| 2009 | $17.44 | +.5% | $10.28 |
+.5% | $7.16 |
| 2008 | $17.41 | +.2% | $10.26 |
+.2% | $7.15 |
| 2007 | $16.93 | +2.8% | $9.98 |
+2.8% | $6.95 |
| Year | This
Occupation | Compared to
All Occupations | Difference |
| Current | $19.97 | | $20.53 |
| -$0.56 |
| 2015 | $19.71 | +1.3% | $19.96 |
+2.9% | -$0.24 |
| 2014 | $19.14 | +2.9% | $19.53 |
+2.2% | -$0.38 |
| 2013 | $18.68 | +2.5% | $19.14 |
+2.1% | -$0.45 |
| 2012 | $18.30 | +2.1% | $18.81 |
+1.7% | -$0.50 |
| 2011 | $17.94 | +2.0% | $18.51 |
+1.6% | -$0.57 |
| 2010 | $17.53 | +2.4% | $18.20 |
+1.7% | -$0.67 |
| 2009 | $17.44 | +.5% | $17.95 |
+1.4% | -$0.50 |
| 2008 | $17.41 | +.2% | $17.49 |
+2.6% | -$0.08 |
| 2007 | $16.93 | +2.8% | $16.94 |
+3.3% | $0.00 |
 |
|
| Reference Date: 1st Quarter 2016 |


