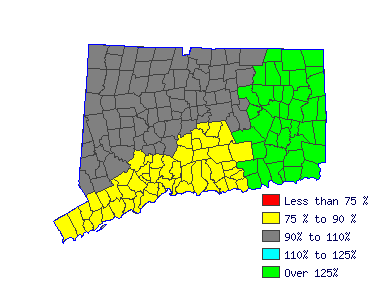
| Northwest WDA (1Q 2016) |
| All Industry |
| Estimated employment | 70 |
| Mean wage | $57,913 |
| Entry wage | $37,476 |
| 10th percentile wage | $28,621 |
| 50th percentile wage | $51,301 |
| 90th percentile wage | $94,938 |
 | | Top Employing Industries |
| Industry | Employment / Percent |
| Education and Health Services | 30 | 41.1% |
 |
| Top Paying Industries |
| Industry | Employment / Median Wage |
| Education and Health Services | 30 | $46,274 |
 | |
 |
| Athletic Trainers (29-9091) |
| Evaluate, advise, and treat athletes to assist recovery from injury, avoid injury, or maintain peak physical fitness. |
 |
| Mean Wage History |
| Year | This
Occupation | Compared to
Occupational Group | Difference |
| Current | $51300.87 | | $71734.78 |
| -$20433.91 | | 2015 | $49997.99 | +2.6% | $69912.94 |
+2.6% | -$19914.95 | | 2014 | $49061.55 | +1.9% | $68603.50 |
+1.9% | -$19541.95 | | 2013 | $48125.10 | +1.9% | $67294.06 |
+1.9% | -$19168.95 | | 2012 | $47188.66 | +2.0% | $65984.61 |
+2.0% | -$18795.95 | | 2011 | $46455.79 | +1.6% | $64959.83 |
+1.6% | -$18504.04 | | 2010 | $45641.49 | +1.8% | $63821.18 |
+1.8% | -$18179.69 | | 2009 | $45152.91 | +1.1% | $63137.99 |
+1.1% | -$17985.08 | | 2008 | $43809.31 | +3.1% | $61259.22 |
+3.1% | -$17449.91 | | 2007 | $42343.58 | +3.5% | $59209.66 |
+3.5% | -$16866.08 |
| Year | This
Occupation | Compared to
All Occupations | Difference |
| Current | $51300.87 | | $40188.76 |
| $11112.11 | | 2015 | $49997.99 | +2.6% | $39064.37 |
+2.9% | $10933.62 | | 2014 | $49061.55 | +1.9% | $38229.12 |
+2.2% | $10832.43 | | 2013 | $48125.10 | +1.9% | $37458.11 |
+2.1% | $10666.99 | | 2012 | $47188.66 | +2.0% | $36815.60 |
+1.7% | $10373.05 | | 2011 | $46455.79 | +1.6% | $36237.35 |
+1.6% | $10218.44 | | 2010 | $45641.49 | +1.8% | $35626.97 |
+1.7% | $10014.52 | | 2009 | $45152.91 | +1.1% | $35145.09 |
+1.4% | $10007.82 | | 2008 | $43809.31 | +3.1% | $34245.58 |
+2.6% | $9563.74 | | 2007 | $42343.58 | +3.5% | $33153.32 |
+3.3% | $9190.26 |
 |
|
| Reference Date: 1st Quarter 2016 |
| Top Areas For This Occupation |
|
|
|

| |


