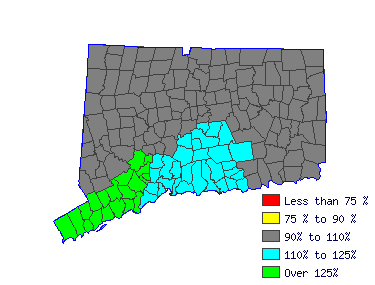
| North Central WDA (1Q 2016) |
| All Industry |
| Estimated employment | 90 |
| Mean wage | $11.28 |
| Entry wage | $9.41 |
| 10th percentile wage | $9.35 |
| 50th percentile wage | $10.18 |
| 90th percentile wage | $14.56 |
 | | Top Employing Industries |
| Industry | Employment / Percent |
| Trade, Transportation and Utilities | | |
 |
| Top Paying Industries |
| Industry | Employment / Median Wage |
| Trade, Transportation and Utilities | | $9.46 |
 | |
 |
| Farmworkers and Laborers, Crop, Nursery, and Greenhouse (45-2092) |
| Manually plant, cultivate, and harvest vegetables, fruits, nuts, horticultural specialties, and field crops. Use hand tools, such as shovels, trowels, hoes, tampers, pruning hooks, shears, and knives. Duties may include tilling soil and applying fertilizers; transplanting, weeding, thinning, or pruning crops; applying pesticides; cleaning, grading, sorting, packing and loading harvested products. May construct trellises, repair fences and farm buildings, or participate in irrigation activities. Exclude "Graders and Sorters, Agricultural Products" (45-2041). Exclude "Forest, Conservation, and Logging Workers" (45-4011 through 45-4029). |
 |
| Mean Wage History |
| Year | This
Occupation | Compared to
Occupational Group | Difference |
| Current | $10.18 | | $11.57 |
| -$1.39 | | 2015 | $9.94 | +2.4% | $11.30 |
+2.4% | -$1.35 | | 2014 | $9.73 | +2.2% | $11.06 |
+2.2% | -$1.32 | | 2013 | $9.58 | +1.5% | $10.89 |
+1.5% | -$1.30 | | 2012 | $9.50 | +.9% | $10.80 |
+.9% | -$1.29 | | 2011 | $9.36 | +1.5% | $10.64 |
+1.5% | -$1.27 | | 2010 | $9.25 | +1.2% | $10.52 |
+1.2% | -$1.26 | | 2009 | $9.15 | +1.1% | $10.40 |
+1.1% | -$1.24 | | 2008 | $8.85 | +3.4% | $10.06 |
+3.4% | -$1.20 | | 2007 | $8.51 | +4.0% | $9.68 |
+4.0% | -$1.16 |
| Year | This
Occupation | Compared to
All Occupations | Difference |
| Current | $10.18 | | $21.85 |
| -$11.67 | | 2015 | $9.94 | +2.4% | $21.24 |
+2.9% | -$11.29 | | 2014 | $9.73 | +2.2% | $20.78 |
+2.2% | -$11.05 | | 2013 | $9.58 | +1.5% | $20.37 |
+2.1% | -$10.78 | | 2012 | $9.50 | +.9% | $20.02 |
+1.7% | -$10.51 | | 2011 | $9.36 | +1.5% | $19.70 |
+1.6% | -$10.34 | | 2010 | $9.25 | +1.2% | $19.37 |
+1.7% | -$10.11 | | 2009 | $9.15 | +1.1% | $19.11 |
+1.4% | -$9.95 | | 2008 | $8.85 | +3.4% | $18.62 |
+2.6% | -$9.76 | | 2007 | $8.51 | +4.0% | $18.02 |
+3.3% | -$9.51 |
 |
|
| Reference Date: 1st Quarter 2016 |
| Top Areas For This Occupation |
|
|
|

| |


