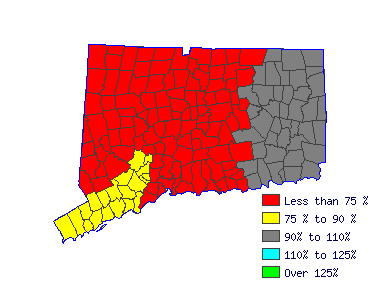
| Eastern WDA (1Q 2016) |
| All Industry |
| Estimated employment | 280 |
| Mean wage | $83,672 |
| Entry wage | $46,474 |
| 10th percentile wage | $42,575 |
| 50th percentile wage | $76,132 |
| 90th percentile wage | $140,461 |
 | | Top Employing Industries |
| Industry | Employment / Percent |
| Education and Health Services | 150 | 52.7% |
| Public Administration | 130 | 47.3% |
 |
| Top Paying Industries |
| Industry | Employment / Median Wage |
| Public Administration | 130 | $94,693 |
| Education and Health Services | 150 | $63,028 |
 | |
 |
| Teachers and Instructors, All Other, Ex. Substitute Teachers (25-3097) |
|
 |
| Mean Wage History |
| Year | This
Occupation | Compared to
Occupational Group | Difference |
| Current | $76131.59 | | $54886.09 |
| $21245.50 | | 2015 | $74198.09 | +2.6% | $53492.16 |
+2.6% | $20705.93 | | 2014 | $72808.39 | +1.9% | $52490.27 |
+1.9% | $20318.12 | | 2013 | $71418.68 | +1.9% | $51488.38 |
+1.9% | $19930.30 | | 2012 | $70028.98 | +2.0% | $50486.49 |
+2.0% | $19542.49 | | 2011 | $68941.38 | +1.6% | $49702.40 |
+1.6% | $19238.98 | | 2010 | $67732.95 | +1.8% | $48831.20 |
+1.8% | $18901.75 | | 2009 | $67007.88 | +1.1% | $48308.47 |
+1.1% | $18699.41 | | 2008 | $65013.96 | +3.1% | $46870.98 |
+3.1% | $18142.98 | | 2007 | $62838.77 | +3.5% | $45302.80 |
+3.5% | $17535.97 |
| Year | This
Occupation | Compared to
All Occupations | Difference |
| Current | $76131.59 | | $42694.83 |
| $33436.76 | | 2015 | $74198.09 | +2.6% | $41500.33 |
+2.9% | $32697.76 | | 2014 | $72808.39 | +1.9% | $40612.99 |
+2.2% | $32195.40 | | 2013 | $71418.68 | +1.9% | $39793.90 |
+2.1% | $31624.78 | | 2012 | $70028.98 | +2.0% | $39111.33 |
+1.7% | $30917.65 | | 2011 | $68941.38 | +1.6% | $38497.02 |
+1.6% | $30444.37 | | 2010 | $67732.95 | +1.8% | $37848.57 |
+1.7% | $29884.37 | | 2009 | $67007.88 | +1.1% | $37336.65 |
+1.4% | $29671.24 | | 2008 | $65013.96 | +3.1% | $36381.05 |
+2.6% | $28632.91 | | 2007 | $62838.77 | +3.5% | $35220.68 |
+3.3% | $27618.10 |
 |
|
| Reference Date: 1st Quarter 2016 |
| Top Areas For This Occupation |
|
|
|

| |


