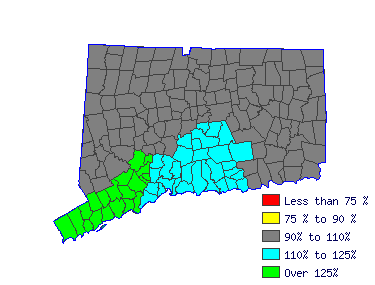
| Plan and direct advertising policies and programs or produce collateral materials, such as posters, contests, coupons, or give-aways, to create extra interest in the purchase of a product or service for a department, an entire organization, or on an account basis. |
 |
| Mean Wage History |
| Year | This
Occupation | Compared to
Occupational Group | Difference |
| Current | $43.89 | | $51.63 |
| -$7.74 |
| 2015 | $42.37 | +3.6% | $49.84 |
+3.6% | -$7.47 |
| 2014 | $41.37 | +2.4% | $48.66 |
+2.4% | -$7.29 |
| 2013 | $40.37 | +2.5% | $47.49 |
+2.5% | -$7.11 |
| 2012 | $39.71 | +1.7% | $46.71 |
+1.7% | -$7.00 |
| 2011 | $39.09 | +1.6% | $45.98 |
+1.6% | -$6.89 |
| 2010 | $38.26 | +2.2% | $45.01 |
+2.2% | -$6.74 |
| 2009 | $37.99 | +.7% | $44.68 |
+.7% | -$6.69 |
| 2008 | $36.81 | +3.2% | $43.30 |
+3.2% | -$6.49 |
| 2007 | $35.60 | +3.4% | $41.88 |
+3.4% | -$6.27 |
| Year | This
Occupation | Compared to
All Occupations | Difference |
| Current | $43.89 | | $20.53 |
| $23.36 |
| 2015 | $42.37 | +3.6% | $19.96 |
+2.9% | $22.41 |
| 2014 | $41.37 | +2.4% | $19.53 |
+2.2% | $21.84 |
| 2013 | $40.37 | +2.5% | $19.14 |
+2.1% | $21.23 |
| 2012 | $39.71 | +1.7% | $18.81 |
+1.7% | $20.90 |
| 2011 | $39.09 | +1.6% | $18.51 |
+1.6% | $20.58 |
| 2010 | $38.26 | +2.2% | $18.20 |
+1.7% | $20.06 |
| 2009 | $37.99 | +.7% | $17.95 |
+1.4% | $20.03 |
| 2008 | $36.81 | +3.2% | $17.49 |
+2.6% | $19.32 |
| 2007 | $35.60 | +3.4% | $16.94 |
+3.3% | $18.67 |
 |
|
| Reference Date: 1st Quarter 2016 |


