CT.Gov Home Connecticut LMI 1Q 2016 Connecticut Occupational Employment & Wages Home
Select Occupation
Norwich-New London LMA (1Q 2016)
All Industry
Estimated employment400
Mean wage$56.19
Entry wage$23.17
10th percentile wage$21.43
50th percentile wage$47.90
90th percentile wageN/A
Top Employing Industries
 IndustryEmployment / Percent
Trade, Transportation and Utilities15036.8%
Professional and Business Services14035.8%
Leisure and Hospitality307.2%
Manufacturing
Top Paying Industries
 IndustryEmployment / Median Wage
Trade, Transportation and Utilities150$72.78
Leisure and Hospitality30$41.53
Professional and Business Services140$33.79
Manufacturing$24.04
Sales Managers (11-2022)
Direct the actual distribution or movement of a product or service to the customer. Coordinate sales distribution by establishing sales territories, quotas, and goals and establish training programs for sales representatives. Analyze sales statistics gathered by staff to determine sales potential and inventory requirements and monitor the preferences of customers.
Mean Wage History
YearThis
Occupation
Compared to
Occupational Group
Difference
Current$47.90 $51.62  -$3.72
2015$46.24+3.6%$49.83 +3.6%-$3.59
2014$45.15+2.4%$48.66 +2.4%-$3.50
2013$44.06+2.5%$47.48 +2.5%-$3.42
2012$43.34+1.7%$46.71 +1.7%-$3.36
2011$42.66+1.6%$45.97 +1.6%-$3.31
2010$41.76+2.2%$45.00 +2.2%-$3.24
2009$41.46+.7%$44.68 +.7%-$3.21
2008$40.17+3.2%$43.29 +3.2%-$3.12
2007$38.86+3.4%$41.87 +3.4%-$3.01
YearThis
Occupation
Compared to
All Occupations
Difference
Current$47.90 $18.90  $29.00
2015$46.24+3.6%$18.37 +2.9%$27.87
2014$45.15+2.4%$17.98 +2.2%$27.17
2013$44.06+2.5%$17.62 +2.1%$26.44
2012$43.34+1.7%$17.31 +1.7%$26.03
2011$42.66+1.6%$17.04 +1.6%$25.62
2010$41.76+2.2%$16.75 +1.7%$25.00
2009$41.46+.7%$16.53 +1.4%$24.93
2008$40.17+3.2%$16.11 +2.6%$24.07
2007$38.86+3.4%$15.59 +3.3%$23.26
Note: The mid-wage is the median wage. The average wage is the mean wage. The entry-level wage is equal to the average of the lower third of reported wages for the occupation. The wage range consists of the 10th and 90th percentiles; 80% of workers earn between this wage range, 10% earn less while 10% earn more.
Reference Date: 1st Quarter 2016
Top Areas For This Occupation
Best Pay
Median Wage / Employment
Bridgeport $75.24 2,530
New Haven $66.41 980
Danbury $61.72 480
Hartford $61.06 2,020
Waterbury $49.93  
Highest Employment
Median Wage / Employment
Bridgeport $75.24 2,530
Hartford $61.06 2,020
New Haven $66.41 980
Danbury $61.72 480
Norwich-NL $47.90 400
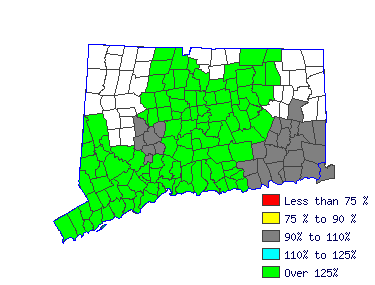
Wages in other areas
Go Connecticut LMI Home State of Connecticut Department of Labor - Office of Research
200 Folly Brook Boulevard, Wethersfield, CT 06109 / Phone: 860-263-6285
LMI Home | CTDOL Home | CT.gov | Feedback | Disclaimer | Privacy Policy | Accessibility Policy
Go to the State of Connecticut website