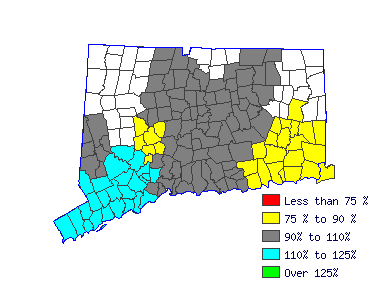
Danbury LMA (1Q 2016) |
All Industry |
Estimated employment | 480 |
Mean wage | $72.84 |
Entry wage | $36.95 |
10th percentile wage | $33.95 |
50th percentile wage | $61.72 |
90th percentile wage | N/A |
 | Top Employing Industries |
Industry | Employment / Percent |
Trade, Transportation and Utilities | 110 | 23.9% |
Professional and Business Services | 100 | 21.2% |
Manufacturing | 50 | 10.3% |
Information | | |
Financial Activities | | |
 |
Top Paying Industries |
Industry | Employment / Median Wage |
Professional and Business Services | 100 | $68.01 |
Trade, Transportation and Utilities | 110 | $60.55 |
Financial Activities | | $55.68 |
Manufacturing | 50 | $55.49 |
Information | | $35.92 |
 | |
 |
Sales Managers (11-2022) |
Direct the actual distribution or movement of a product or service to the customer. Coordinate sales distribution by establishing sales territories, quotas, and goals and establish training programs for sales representatives. Analyze sales statistics gathered by staff to determine sales potential and inventory requirements and monitor the preferences of customers. |
 |
Mean Wage History |
Year | This Occupation | Compared to Occupational Group | Difference |
Current | $61.72 | | $54.81 |
| $6.91 | 2015 | $59.58 | +3.6% | $52.91 |
+3.6% | $6.67 | 2014 | $58.18 | +2.4% | $51.66 |
+2.4% | $6.51 | 2013 | $56.77 | +2.5% | $50.41 |
+2.5% | $6.36 | 2012 | $55.84 | +1.7% | $49.59 |
+1.7% | $6.25 | 2011 | $54.97 | +1.6% | $48.82 |
+1.6% | $6.15 | 2010 | $53.80 | +2.2% | $47.78 |
+2.2% | $6.02 | 2009 | $53.42 | +.7% | $47.44 |
+.7% | $5.98 | 2008 | $51.77 | +3.2% | $45.97 |
+3.2% | $5.80 | 2007 | $50.07 | +3.4% | $44.46 |
+3.4% | $5.61 |
Year | This Occupation | Compared to All Occupations | Difference |
Current | $61.72 | | $19.47 |
| $42.25 | 2015 | $59.58 | +3.6% | $18.93 |
+2.9% | $40.66 | 2014 | $58.18 | +2.4% | $18.52 |
+2.2% | $39.65 | 2013 | $56.77 | +2.5% | $18.15 |
+2.1% | $38.62 | 2012 | $55.84 | +1.7% | $17.84 |
+1.7% | $38.01 | 2011 | $54.97 | +1.6% | $17.56 |
+1.6% | $37.41 | 2010 | $53.80 | +2.2% | $17.26 |
+1.7% | $36.54 | 2009 | $53.42 | +.7% | $17.03 |
+1.4% | $36.39 | 2008 | $51.77 | +3.2% | $16.59 |
+2.6% | $35.17 | 2007 | $50.07 | +3.4% | $16.06 |
+3.3% | $34.00 |
 |
Reference Date: 1st Quarter 2016 |
|