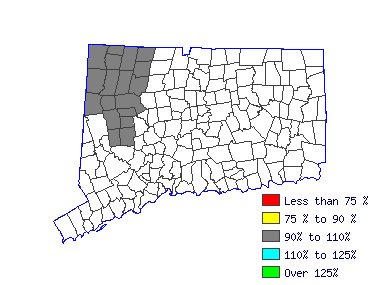
 |
| Mean Wage History |
| Year | This
Occupation | Compared to
Occupational Group | Difference |
| Current | $15.86 | | $10.10 |
| $5.76 |
| 2015 | $15.44 | +2.7% | $9.83 |
+2.7% | $5.61 |
| 2014 | $15.13 | +2.0% | $9.64 |
+2.0% | $5.50 |
| 2013 | $14.94 | +1.3% | $9.51 |
+1.3% | $5.43 |
| 2012 | $14.72 | +1.5% | $9.38 |
+1.5% | $5.35 |
| 2011 | $14.52 | +1.4% | $9.24 |
+1.4% | $5.27 |
| 2010 | $14.36 | +1.1% | $9.15 |
+1.1% | $5.22 |
| 2009 | $14.08 | +2.0% | $8.97 |
+2.0% | $5.11 |
| 2008 | $13.70 | +2.8% | $8.72 |
+2.8% | $4.97 |
| 2007 | $13.16 | +4.1% | $8.38 |
+4.1% | $4.78 |
| Year | This
Occupation | Compared to
All Occupations | Difference |
| Current | $15.86 | | $18.42 |
| -$2.56 |
| 2015 | $15.44 | +2.7% | $17.90 |
+2.9% | -$2.46 |
| 2014 | $15.13 | +2.0% | $17.52 |
+2.2% | -$2.39 |
| 2013 | $14.94 | +1.3% | $17.17 |
+2.1% | -$2.22 |
| 2012 | $14.72 | +1.5% | $16.87 |
+1.7% | -$2.15 |
| 2011 | $14.52 | +1.4% | $16.61 |
+1.6% | -$2.09 |
| 2010 | $14.36 | +1.1% | $16.33 |
+1.7% | -$1.96 |
| 2009 | $14.08 | +2.0% | $16.11 |
+1.4% | -$2.02 |
| 2008 | $13.70 | +2.8% | $15.70 |
+2.6% | -$1.99 |
| 2007 | $13.16 | +4.1% | $15.20 |
+3.3% | -$2.03 |
 |
|
| Reference Date: 1st Quarter 2016 |


