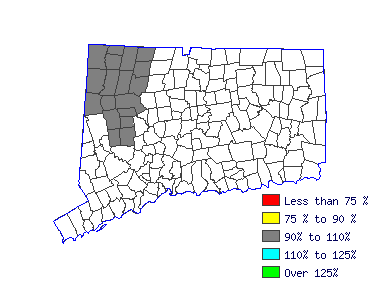
 |
| Mean Wage History |
| Year | This
Occupation | Compared to
Occupational Group | Difference |
| Current | $20129.28 | | $88386.69 |
| -$68257.41 |
| 2015 | $19432.44 | +3.6% | $85326.88 |
+3.6% | -$65894.44 |
| 2014 | $18973.15 | +2.4% | $83310.19 |
+2.4% | -$64337.03 |
| 2013 | $18513.87 | +2.5% | $81293.50 |
+2.5% | -$62779.63 |
| 2012 | $18212.96 | +1.7% | $79972.22 |
+1.7% | -$61759.26 |
| 2011 | $17927.89 | +1.6% | $78720.48 |
+1.6% | -$60792.59 |
| 2010 | $17547.79 | +2.2% | $77051.50 |
+2.2% | -$59503.70 |
| 2009 | $17421.09 | +.7% | $76495.17 |
+.7% | -$59074.07 |
| 2008 | $16882.62 | +3.2% | $74130.77 |
+3.2% | -$57248.15 |
| 2007 | $16328.31 | +3.4% | $71696.84 |
+3.4% | -$55368.52 |
| Year | This
Occupation | Compared to
All Occupations | Difference |
| Current | $20129.28 | | $38323.96 |
| -$18194.68 |
| 2015 | $19432.44 | +3.6% | $37251.75 |
+2.9% | -$17819.31 |
| 2014 | $18973.15 | +2.4% | $36455.25 |
+2.2% | -$17482.09 |
| 2013 | $18513.87 | +2.5% | $35720.01 |
+2.1% | -$17206.14 |
| 2012 | $18212.96 | +1.7% | $35107.32 |
+1.7% | -$16894.36 |
| 2011 | $17927.89 | +1.6% | $34555.90 |
+1.6% | -$16628.00 |
| 2010 | $17547.79 | +2.2% | $33973.84 |
+1.7% | -$16426.04 |
| 2009 | $17421.09 | +.7% | $33514.32 |
+1.4% | -$16093.22 |
| 2008 | $16882.62 | +3.2% | $32656.55 |
+2.6% | -$15773.92 |
| 2007 | $16328.31 | +3.4% | $31614.97 |
+3.3% | -$15286.65 |
 |
|
| Reference Date: 1st Quarter 2016 |


