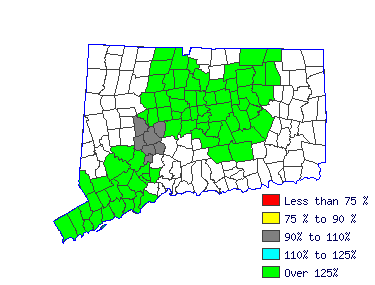
| Install, service, adjust, or repair coin, vending, or amusement machines including video games, juke boxes, pinball machines, or slot machines. |
 |
| Mean Wage History |
| Year | This
Occupation | Compared to
Occupational Group | Difference |
| Current | $14.60 | | $21.16 |
| -$6.56 |
| 2015 | $14.24 | +2.5% | $20.63 |
+2.5% | -$6.39 |
| 2014 | $13.94 | +2.1% | $20.21 |
+2.1% | -$6.26 |
| 2013 | $13.65 | +2.1% | $19.79 |
+2.1% | -$6.13 |
| 2012 | $13.45 | +1.5% | $19.50 |
+1.5% | -$6.04 |
| 2011 | $13.16 | +2.2% | $19.07 |
+2.2% | -$5.91 |
| 2010 | $13.01 | +1.2% | $18.85 |
+1.2% | -$5.84 |
| 2009 | $12.79 | +1.7% | $18.53 |
+1.7% | -$5.74 |
| 2008 | $12.41 | +3.0% | $17.99 |
+3.0% | -$5.57 |
| 2007 | $12.05 | +3.0% | $17.46 |
+3.0% | -$5.41 |
| Year | This
Occupation | Compared to
All Occupations | Difference |
| Current | $14.60 | | $18.24 |
| -$3.64 |
| 2015 | $14.24 | +2.5% | $17.73 |
+2.9% | -$3.49 |
| 2014 | $13.94 | +2.1% | $17.35 |
+2.2% | -$3.40 |
| 2013 | $13.65 | +2.1% | $17.00 |
+2.1% | -$3.34 |
| 2012 | $13.45 | +1.5% | $16.71 |
+1.7% | -$3.25 |
| 2011 | $13.16 | +2.2% | $16.45 |
+1.6% | -$3.28 |
| 2010 | $13.01 | +1.2% | $16.17 |
+1.7% | -$3.16 |
| 2009 | $12.79 | +1.7% | $15.95 |
+1.4% | -$3.16 |
| 2008 | $12.41 | +3.0% | $15.54 |
+2.6% | -$3.13 |
| 2007 | $12.05 | +3.0% | $15.05 |
+3.3% | -$2.99 |
 |
|
| Reference Date: 1st Quarter 2016 |


