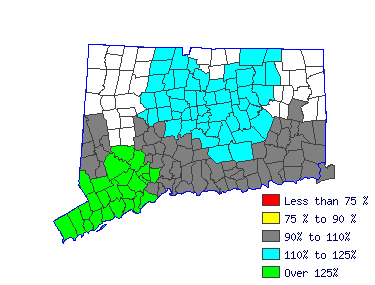
| Waterbury LMA (1Q 2016) |
| All Industry |
| Estimated employment | 320 |
| Mean wage | $17.13 |
| Entry wage | $12.86 |
| 10th percentile wage | $12.28 |
| 50th percentile wage | $16.41 |
| 90th percentile wage | $23.52 |
 | | Top Employing Industries |
| Industry | Employment / Percent |
| Education and Health Services | 210 | 65.2% |
 |
| Top Paying Industries |
| Industry | Employment / Median Wage |
| Education and Health Services | 210 | $16.70 |
 | |
 |
| Social and Human Service Assistants (21-1093) |
| Assist professionals from a wide variety of fields, such as psychology, rehabilitation, or social work, to provide client services, as well as support for families. May assist clients in identifying available benefits and social and community services and help clients obtain them. May assist social workers with developing, organizing, and conducting programs to prevent and resolve problems relevant to substance abuse, human relationships, rehabilitation, or adult daycare. Exclude "Rehabilitation Counselors" (21-1015), "Personal and Home Care Aides" (39-9021), "Eligibility Interviewers, Government Programs" (43-4061), and "Psychiatric Technicians" (29-2053). |
 |
| Mean Wage History |
| Year | This
Occupation | Compared to
Occupational Group | Difference |
| Current | $16.41 | | $24.38 |
| -$7.97 | | 2015 | $15.99 | +2.6% | $23.76 |
+2.6% | -$7.76 | | 2014 | $15.69 | +1.9% | $23.32 |
+1.9% | -$7.62 | | 2013 | $15.39 | +1.9% | $22.87 |
+1.9% | -$7.47 | | 2012 | $15.09 | +2.0% | $22.43 |
+2.0% | -$7.33 | | 2011 | $14.86 | +1.6% | $22.08 |
+1.6% | -$7.21 | | 2010 | $14.60 | +1.8% | $21.69 |
+1.8% | -$7.09 | | 2009 | $14.44 | +1.1% | $21.46 |
+1.1% | -$7.01 | | 2008 | $14.01 | +3.1% | $20.82 |
+3.1% | -$6.80 | | 2007 | $13.54 | +3.5% | $20.12 |
+3.5% | -$6.57 |
| Year | This
Occupation | Compared to
All Occupations | Difference |
| Current | $16.41 | | $18.24 |
| -$1.83 | | 2015 | $15.99 | +2.6% | $17.73 |
+2.9% | -$1.73 | | 2014 | $15.69 | +1.9% | $17.35 |
+2.2% | -$1.65 | | 2013 | $15.39 | +1.9% | $17.00 |
+2.1% | -$1.60 | | 2012 | $15.09 | +2.0% | $16.71 |
+1.7% | -$1.61 | | 2011 | $14.86 | +1.6% | $16.45 |
+1.6% | -$1.58 | | 2010 | $14.60 | +1.8% | $16.17 |
+1.7% | -$1.56 | | 2009 | $14.44 | +1.1% | $15.95 |
+1.4% | -$1.50 | | 2008 | $14.01 | +3.1% | $15.54 |
+2.6% | -$1.52 | | 2007 | $13.54 | +3.5% | $15.05 |
+3.3% | -$1.50 |
 |
|
| Reference Date: 1st Quarter 2016 |
| Top Areas For This Occupation |
|
|
|

| |


