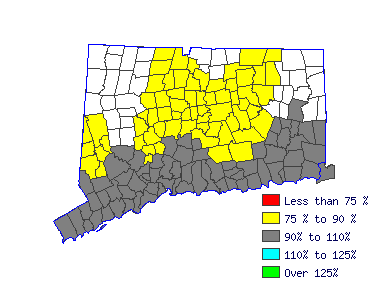
Norwich-New London LMA (1Q 2016) |
All Industry |
Estimated employment | 950 |
Mean wage | $35.92 |
Entry wage | $21.10 |
10th percentile wage | $20.52 |
50th percentile wage | $34.68 |
90th percentile wage | $55.59 |
 | Top Employing Industries |
Industry | Employment / Percent |
Manufacturing | 670 | 71% |
Trade, Transportation and Utilities | 110 | 11.1% |
Public Administration | 20 | 2.4% |
Professional and Business Services | 10 | 1.2% |
 |
Top Paying Industries |
Industry | Employment / Median Wage |
Trade, Transportation and Utilities | 110 | $52.88 |
Professional and Business Services | 10 | $36.83 |
Public Administration | 20 | $33.17 |
Manufacturing | 670 | $31.80 |
 | |
 |
1st-Line Supervisors of Production and Operating Workers (51-1011) |
Directly supervise and coordinate the activities of production and operating workers, such as inspectors, precision workers, machine setters and operators, assemblers, fabricators, and plant and system operators. Excludes team or work leaders. |
 |
Mean Wage History |
Year | This Occupation | Compared to Occupational Group | Difference |
Current | $34.68 | | $22.20 |
| $12.48 | 2015 | $33.58 | +3.3% | $21.50 |
+3.3% | $12.08 | 2014 | $32.82 | +2.3% | $21.01 |
+2.3% | $11.81 | 2013 | $32.20 | +1.9% | $20.61 |
+1.9% | $11.59 | 2012 | $31.66 | +1.7% | $20.27 |
+1.7% | $11.39 | 2011 | $31.16 | +1.6% | $19.94 |
+1.6% | $11.21 | 2010 | $30.82 | +1.1% | $19.73 |
+1.1% | $11.09 | 2009 | $30.28 | +1.8% | $19.38 |
+1.8% | $10.90 | 2008 | $29.49 | +2.7% | $18.88 |
+2.7% | $10.61 | 2007 | $28.82 | +2.3% | $18.45 |
+2.3% | $10.37 |
Year | This Occupation | Compared to All Occupations | Difference |
Current | $34.68 | | $18.90 |
| $15.78 | 2015 | $33.58 | +3.3% | $18.37 |
+2.9% | $15.21 | 2014 | $32.82 | +2.3% | $17.98 |
+2.2% | $14.84 | 2013 | $32.20 | +1.9% | $17.62 |
+2.1% | $14.58 | 2012 | $31.66 | +1.7% | $17.31 |
+1.7% | $14.35 | 2011 | $31.16 | +1.6% | $17.04 |
+1.6% | $14.11 | 2010 | $30.82 | +1.1% | $16.75 |
+1.7% | $14.06 | 2009 | $30.28 | +1.8% | $16.53 |
+1.4% | $13.75 | 2008 | $29.49 | +2.7% | $16.11 |
+2.6% | $13.39 | 2007 | $28.82 | +2.3% | $15.59 |
+3.3% | $13.22 |
 |
Reference Date: 1st Quarter 2016 |
|