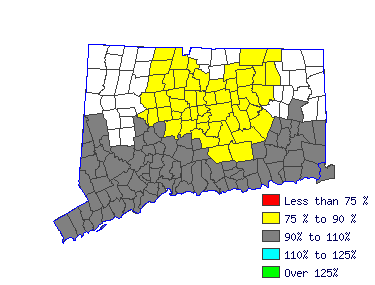
| Norwich-New London LMA (1Q 2016) |
| All Industry |
| Estimated employment | 1,630 |
| Mean wage | $32,788 |
| Entry wage | $26,874 |
| 10th percentile wage | $25,728 |
| 50th percentile wage | $32,312 |
| 90th percentile wage | $39,657 |
 | | Top Employing Industries |
| Industry | Employment / Percent |
| Education and Health Services | 1,550 | 95.5% |
 |
| Top Paying Industries |
| Industry | Employment / Median Wage |
| Education and Health Services | 1,550 | $32,642 |
 | |
 |
| Teacher Assistants (25-9041) |
| Perform duties that are instructional in nature or deliver direct services to students or parents. Serve in a position for which a teacher or another professional has ultimate responsibility for the design and implementation of educational programs and services. |
 |
| Mean Wage History |
| Year | This
Occupation | Compared to
Occupational Group | Difference |
| Current | $32311.59 | | $56253.62 |
| -$23942.03 | | 2015 | $31490.98 | +2.6% | $54824.96 |
+2.6% | -$23333.97 | | 2014 | $30901.16 | +1.9% | $53798.10 |
+1.9% | -$22896.94 | | 2013 | $30311.35 | +1.9% | $52771.25 |
+1.9% | -$22459.90 | | 2012 | $29721.53 | +2.0% | $51744.40 |
+2.0% | -$22022.86 | | 2011 | $29259.94 | +1.6% | $50940.78 |
+1.6% | -$21680.83 | | 2010 | $28747.06 | +1.8% | $50047.86 |
+1.8% | -$21300.80 | | 2009 | $28439.33 | +1.1% | $49512.11 |
+1.1% | -$21072.78 | | 2008 | $27593.07 | +3.1% | $48038.81 |
+3.1% | -$20445.73 | | 2007 | $26669.88 | +3.5% | $46431.56 |
+3.5% | -$19761.67 |
| Year | This
Occupation | Compared to
All Occupations | Difference |
| Current | $32311.59 | | $39321.51 |
| -$7009.92 | | 2015 | $31490.98 | +2.6% | $38221.39 |
+2.9% | -$6730.40 | | 2014 | $30901.16 | +1.9% | $37404.15 |
+2.2% | -$6502.99 | | 2013 | $30311.35 | +1.9% | $36649.78 |
+2.1% | -$6338.43 | | 2012 | $29721.53 | +2.0% | $36021.14 |
+1.7% | -$6299.60 | | 2011 | $29259.94 | +1.6% | $35455.37 |
+1.6% | -$6195.42 | | 2010 | $28747.06 | +1.8% | $34858.16 |
+1.7% | -$6111.09 | | 2009 | $28439.33 | +1.1% | $34386.68 |
+1.4% | -$5947.34 | | 2008 | $27593.07 | +3.1% | $33506.58 |
+2.6% | -$5913.50 | | 2007 | $26669.88 | +3.5% | $32437.89 |
+3.3% | -$5768.00 |
 |
|
| Reference Date: 1st Quarter 2016 |
| Top Areas For This Occupation |
|
| Highest Employment |
|
| Hartford |
$26,884 |
7,730 |
| Bridgeport |
$32,991 |
4,950 |
| New Haven |
$29,725 |
3,890 |
| Norwich-NL |
$32,312 |
1,630 |
| Waterbury |
$33,996 |
1,240 |
|
|

| |


