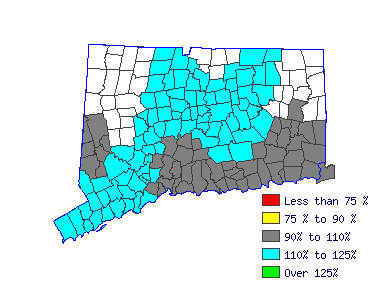
| Norwich-New London LMA (1Q 2016) |
| All Industry |
| Estimated employment | 1,150 |
| Mean wage | $70,406 |
| Entry wage | $49,142 |
| 10th percentile wage | $45,084 |
| 50th percentile wage | $70,051 |
| 90th percentile wage | $97,341 |
 | | Top Employing Industries |
| Industry | Employment / Percent |
| Education and Health Services | 1,060 | 92.7% |
 |
| Top Paying Industries |
| Industry | Employment / Median Wage |
| Education and Health Services | 1,060 | $69,870 |
 | |
 |
| Elementary School Teachers, Ex. Special Education (25-2021) |
| Teach pupils in public or private schools at the elementary level basic academic, social, and other formative skills. Exclude "Special Education Teachers" (25-2041 through 25-2043). |
 |
| Mean Wage History |
| Year | This
Occupation | Compared to
Occupational Group | Difference |
| Current | $70050.72 | | $56253.62 |
| $13797.10 | | 2015 | $68271.65 | +2.6% | $54824.96 |
+2.6% | $13446.70 | | 2014 | $66992.95 | +1.9% | $53798.10 |
+1.9% | $13194.85 | | 2013 | $65714.25 | +1.9% | $52771.25 |
+1.9% | $12942.99 | | 2012 | $64435.54 | +2.0% | $51744.40 |
+2.0% | $12691.14 | | 2011 | $63434.82 | +1.6% | $50940.78 |
+1.6% | $12494.04 | | 2010 | $62322.90 | +1.8% | $50047.86 |
+1.8% | $12275.04 | | 2009 | $61655.75 | +1.1% | $49512.11 |
+1.1% | $12143.64 | | 2008 | $59821.09 | +3.1% | $48038.81 |
+3.1% | $11782.29 | | 2007 | $57819.64 | +3.5% | $46431.56 |
+3.5% | $11388.08 |
| Year | This
Occupation | Compared to
All Occupations | Difference |
| Current | $70050.72 | | $39321.51 |
| $30729.21 | | 2015 | $68271.65 | +2.6% | $38221.39 |
+2.9% | $30050.27 | | 2014 | $66992.95 | +1.9% | $37404.15 |
+2.2% | $29588.80 | | 2013 | $65714.25 | +1.9% | $36649.78 |
+2.1% | $29064.46 | | 2012 | $64435.54 | +2.0% | $36021.14 |
+1.7% | $28414.40 | | 2011 | $63434.82 | +1.6% | $35455.37 |
+1.6% | $27979.45 | | 2010 | $62322.90 | +1.8% | $34858.16 |
+1.7% | $27464.75 | | 2009 | $61655.75 | +1.1% | $34386.68 |
+1.4% | $27269.08 | | 2008 | $59821.09 | +3.1% | $33506.58 |
+2.6% | $26314.51 | | 2007 | $57819.64 | +3.5% | $32437.89 |
+3.3% | $25381.75 |
 |
|
| Reference Date: 1st Quarter 2016 |
| Top Areas For This Occupation |
|
| Highest Employment |
|
| Hartford |
$77,254 |
5,620 |
| Bridgeport |
$80,267 |
5,140 |
| New Haven |
$73,510 |
3,040 |
| Norwich-NL |
$70,051 |
1,150 |
| Waterbury |
$81,170 |
1,040 |
|
|

| |


