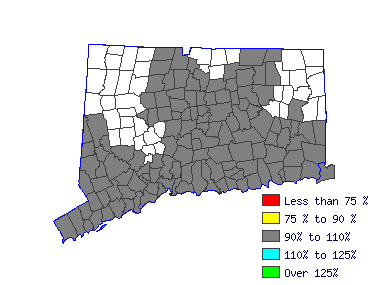
New Haven LMA (1Q 2016) |
All Industry |
Estimated employment | 140 |
Mean wage | $52.19 |
Entry wage | $41.17 |
10th percentile wage | $40.06 |
50th percentile wage | $52.09 |
90th percentile wage | $68.83 |
 | Top Employing Industries |
Industry | Employment / Percent |
Professional and Business Services | 40 | 26.7% |
Financial Activities | 20 | 11.6% |
Education and Health Services | 10 | 9.5% |
Information | | |
 |
Top Paying Industries |
Industry | Employment / Median Wage |
Education and Health Services | 10 | $55.42 |
Information | | $53.04 |
Professional and Business Services | 40 | $49.06 |
Financial Activities | 20 | $48.08 |
 | |
 |
Computer Network Architects (15-1143) |
Design and implement computer and information networks, such as local area networks (LAN), wide area networks (WAN), intranets, extranets, and other data communications networks. Perform network modeling, analysis, and planning. May also design network and computer security measures. May research and recommend network and data communications hardware and software. Excludes Information Security Analysts (15-1122), Network and Computer Systems Administrators (15-1142), and Computer Network Support Specialists (15-1152). |
 |
Mean Wage History |
Year | This Occupation | Compared to Occupational Group | Difference |
Current | $52.09 | | $38.16 |
| $13.93 | 2015 | $50.77 | +2.6% | $37.19 |
+2.6% | $13.58 | 2014 | $49.82 | +1.9% | $36.49 |
+1.9% | $13.32 | 2013 | $48.87 | +1.9% | $35.80 |
+1.9% | $13.07 | 2012 | $47.91 | +2.0% | $35.10 |
+2.0% | $12.81 | 2011 | $47.17 | +1.6% | $34.56 |
+1.6% | $12.61 | 2010 | $46.34 | +1.8% | $33.95 |
+1.8% | $12.39 | 2009 | $45.85 | +1.1% | $33.59 |
+1.1% | $12.26 | 2008 | $44.48 | +3.1% | $32.59 |
+3.1% | $11.90 | 2007 | $42.99 | +3.5% | $31.50 |
+3.5% | $11.50 |
Year | This Occupation | Compared to All Occupations | Difference |
Current | $52.09 | | $20.98 |
| $31.11 | 2015 | $50.77 | +2.6% | $20.39 |
+2.9% | $30.37 | 2014 | $49.82 | +1.9% | $19.96 |
+2.2% | $29.86 | 2013 | $48.87 | +1.9% | $19.55 |
+2.1% | $29.31 | 2012 | $47.91 | +2.0% | $19.22 |
+1.7% | $28.70 | 2011 | $47.17 | +1.6% | $18.92 |
+1.6% | $28.25 | 2010 | $46.34 | +1.8% | $18.60 |
+1.7% | $27.74 | 2009 | $45.85 | +1.1% | $18.35 |
+1.4% | $27.50 | 2008 | $44.48 | +3.1% | $17.88 |
+2.6% | $26.61 | 2007 | $42.99 | +3.5% | $17.31 |
+3.3% | $25.69 |
 |
Reference Date: 1st Quarter 2016 |
|