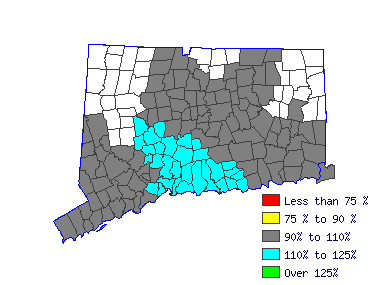
Hartford LMA (1Q 2016) |
All Industry |
Estimated employment | 560 |
Mean wage | $13.70 |
Entry wage | $10.31 |
10th percentile wage | $9.49 |
50th percentile wage | $12.28 |
90th percentile wage | $19.91 |
 | Top Employing Industries |
Industry | Employment / Percent |
Trade, Transportation and Utilities | 240 | 42.8% |
Manufacturing | 200 | 36.3% |
Leisure and Hospitality | 100 | 18% |
 |
Top Paying Industries |
Industry | Employment / Median Wage |
Leisure and Hospitality | 100 | $13.25 |
Trade, Transportation and Utilities | 240 | $12.48 |
Manufacturing | 200 | $11.62 |
 | |
 |
Bakers (51-3011) |
Mix and bake ingredients according to recipes to produce breads, rolls, cookies, cakes, pies, pastries, or other baked goods. Include pastry chefs in restaurants and hotels with "Chefs and Head Cooks" (35-1011). |
 |
Mean Wage History |
Year | This Occupation | Compared to Occupational Group | Difference |
Current | $12.28 | | $19.16 |
| -$6.88 | 2015 | $11.89 | +3.3% | $18.55 |
+3.3% | -$6.66 | 2014 | $11.62 | +2.3% | $18.13 |
+2.3% | -$6.51 | 2013 | $11.40 | +1.9% | $17.79 |
+1.9% | -$6.38 | 2012 | $11.21 | +1.7% | $17.49 |
+1.7% | -$6.28 | 2011 | $11.03 | +1.6% | $17.21 |
+1.6% | -$6.18 | 2010 | $10.91 | +1.1% | $17.03 |
+1.1% | -$6.11 | 2009 | $10.72 | +1.8% | $16.73 |
+1.8% | -$6.00 | 2008 | $10.44 | +2.7% | $16.29 |
+2.7% | -$5.85 | 2007 | $10.20 | +2.3% | $15.92 |
+2.3% | -$5.71 |
Year | This Occupation | Compared to All Occupations | Difference |
Current | $12.28 | | $22.30 |
| -$10.02 | 2015 | $11.89 | +3.3% | $21.68 |
+2.9% | -$9.78 | 2014 | $11.62 | +2.3% | $21.21 |
+2.2% | -$9.59 | 2013 | $11.40 | +1.9% | $20.78 |
+2.1% | -$9.38 | 2012 | $11.21 | +1.7% | $20.43 |
+1.7% | -$9.21 | 2011 | $11.03 | +1.6% | $20.11 |
+1.6% | -$9.07 | 2010 | $10.91 | +1.1% | $19.77 |
+1.7% | -$8.85 | 2009 | $10.72 | +1.8% | $19.50 |
+1.4% | -$8.77 | 2008 | $10.44 | +2.7% | $19.00 |
+2.6% | -$8.55 | 2007 | $10.20 | +2.3% | $18.40 |
+3.3% | -$8.19 |
 |
Reference Date: 1st Quarter 2016 |
|