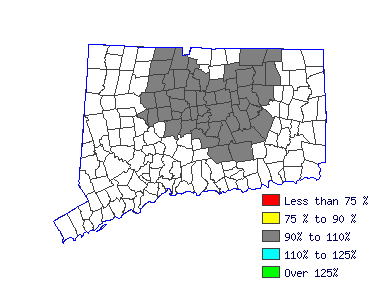
| Hartford LMA (1Q 2016) |
| All Industry |
| Estimated employment | 60 |
| Mean wage | $12.93 |
| Entry wage | $10.52 |
| 10th percentile wage | $9.83 |
| 50th percentile wage | $12.18 |
| 90th percentile wage | $17.60 |
 | | Top Employing Industries |
| Industry | Employment / Percent |
| Natural resouces and mining | 40 | 60.5% |
 |
| Top Paying Industries |
| Industry | Employment / Median Wage |
| Natural resouces and mining | 40 | $11.79 |
 | |
 |
| Farmworkers, Farm, Ranch, and Aquacultural Animals (45-2093) |
| Attend to live farm, ranch, or aquacultural animals that may include cattle, sheep, swine, goats, horses and other equines, poultry, finfish, shellfish, and bees. Attend to animals produced for animal products, such as meat, fur, skins, feathers, eggs, |
 |
| Mean Wage History |
| Year | This
Occupation | Compared to
Occupational Group | Difference |
| Current | $12.18 | | $11.46 |
| $0.72 | | 2015 | $11.90 | +2.4% | $11.19 |
+2.4% | $0.70 | | 2014 | $11.64 | +2.2% | $10.95 |
+2.2% | $0.69 | | 2013 | $11.46 | +1.5% | $10.79 |
+1.5% | $0.68 | | 2012 | $11.36 | +.9% | $10.69 |
+.9% | $0.67 | | 2011 | $11.20 | +1.5% | $10.54 |
+1.5% | $0.66 | | 2010 | $11.07 | +1.2% | $10.42 |
+1.2% | $0.65 | | 2009 | $10.95 | +1.1% | $10.30 |
+1.1% | $0.65 | | 2008 | $10.59 | +3.4% | $9.96 |
+3.4% | $0.63 | | 2007 | $10.19 | +4.0% | $9.58 |
+4.0% | $0.60 |
| Year | This
Occupation | Compared to
All Occupations | Difference |
| Current | $12.18 | | $22.30 |
| -$10.12 | | 2015 | $11.90 | +2.4% | $21.68 |
+2.9% | -$9.78 | | 2014 | $11.64 | +2.2% | $21.21 |
+2.2% | -$9.57 | | 2013 | $11.46 | +1.5% | $20.78 |
+2.1% | -$9.32 | | 2012 | $11.36 | +.9% | $20.43 |
+1.7% | -$9.06 | | 2011 | $11.20 | +1.5% | $20.11 |
+1.6% | -$8.90 | | 2010 | $11.07 | +1.2% | $19.77 |
+1.7% | -$8.69 | | 2009 | $10.95 | +1.1% | $19.50 |
+1.4% | -$8.54 | | 2008 | $10.59 | +3.4% | $19.00 |
+2.6% | -$8.41 | | 2007 | $10.19 | +4.0% | $18.40 |
+3.3% | -$8.21 |
 |
|
| Reference Date: 1st Quarter 2016 |
| Top Areas For This Occupation |
|
|
|

| |


