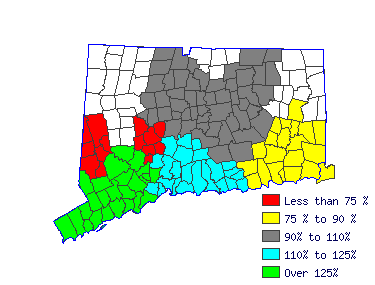
| Buy and sell securities in investment and trading firms, or call upon businesses and individuals to sell financial services. Provide financial services, such as loan, tax, and securities counseling. May advise securities customers about such things as stocks, bonds, and market conditions. |
 |
| Mean Wage History |
| Year | This
Occupation | Compared to
Occupational Group | Difference |
| Current | $39.97 | | $14.01 |
| $25.96 |
| 2015 | $39.44 | +1.3% | $13.82 |
+1.3% | $25.62 |
| 2014 | $38.32 | +2.9% | $13.43 |
+2.9% | $24.89 |
| 2013 | $37.39 | +2.5% | $13.11 |
+2.5% | $24.29 |
| 2012 | $36.63 | +2.1% | $12.84 |
+2.1% | $23.79 |
| 2011 | $35.91 | +2.0% | $12.59 |
+2.0% | $23.32 |
| 2010 | $35.08 | +2.4% | $12.30 |
+2.4% | $22.78 |
| 2009 | $34.92 | +.5% | $12.24 |
+.5% | $22.68 |
| 2008 | $34.85 | +.2% | $12.22 |
+.2% | $22.63 |
| 2007 | $33.89 | +2.8% | $11.88 |
+2.8% | $22.01 |
| Year | This
Occupation | Compared to
All Occupations | Difference |
| Current | $39.97 | | $22.30 |
| $17.67 |
| 2015 | $39.44 | +1.3% | $21.68 |
+2.9% | $17.77 |
| 2014 | $38.32 | +2.9% | $21.21 |
+2.2% | $17.11 |
| 2013 | $37.39 | +2.5% | $20.78 |
+2.1% | $16.61 |
| 2012 | $36.63 | +2.1% | $20.43 |
+1.7% | $16.21 |
| 2011 | $35.91 | +2.0% | $20.11 |
+1.6% | $15.80 |
| 2010 | $35.08 | +2.4% | $19.77 |
+1.7% | $15.31 |
| 2009 | $34.92 | +.5% | $19.50 |
+1.4% | $15.41 |
| 2008 | $34.85 | +.2% | $19.00 |
+2.6% | $15.85 |
| 2007 | $33.89 | +2.8% | $18.40 |
+3.3% | $15.50 |
 |
|
| Reference Date: 1st Quarter 2016 |


