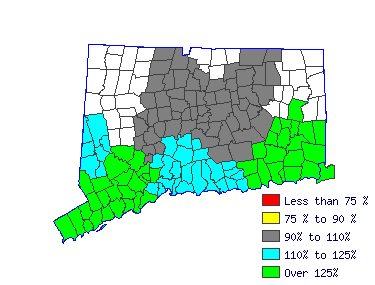
| Hartford LMA (1Q 2016) |
| All Industry |
| Estimated employment | 1,110 |
| Mean wage | $49,122 |
| Entry wage | $29,725 |
| 10th percentile wage | $26,184 |
| 50th percentile wage | $45,277 |
| 90th percentile wage | $76,696 |
 | | Top Employing Industries |
| Industry | Employment / Percent |
| Education and Health Services | 950 | 85% |
 |
| Top Paying Industries |
| Industry | Employment / Median Wage |
| Education and Health Services | 950 | $45,399 |
 | |
 |
| Teachers and Instructors, All Other, Ex. Substitute Teachers (25-3097) |
|
 |
| Mean Wage History |
| Year | This
Occupation | Compared to
Occupational Group | Difference |
| Current | $45276.81 | | $55604.35 |
| -$10327.54 | | 2015 | $44126.92 | +2.6% | $54192.18 |
+2.6% | -$10065.25 | | 2014 | $43300.44 | +1.9% | $53177.18 |
+1.9% | -$9876.73 | | 2013 | $42473.96 | +1.9% | $52162.18 |
+1.9% | -$9688.21 | | 2012 | $41647.48 | +2.0% | $51147.18 |
+2.0% | -$9499.69 | | 2011 | $41000.67 | +1.6% | $50352.83 |
+1.6% | -$9352.16 | | 2010 | $40281.99 | +1.8% | $49470.22 |
+1.8% | -$9188.23 | | 2009 | $39850.78 | +1.1% | $48940.65 |
+1.1% | -$9089.87 | | 2008 | $38664.96 | +3.1% | $47484.35 |
+3.1% | -$8819.39 | | 2007 | $37371.34 | +3.5% | $45895.65 |
+3.5% | -$8524.31 |
| Year | This
Occupation | Compared to
All Occupations | Difference |
| Current | $45276.81 | | $46385.74 |
| -$1108.93 | | 2015 | $44126.92 | +2.6% | $45087.98 |
+2.9% | -$961.05 | | 2014 | $43300.44 | +1.9% | $44123.93 |
+2.2% | -$823.48 | | 2013 | $42473.96 | +1.9% | $43234.03 |
+2.1% | -$760.07 | | 2012 | $41647.48 | +2.0% | $42492.45 |
+1.7% | -$844.97 | | 2011 | $41000.67 | +1.6% | $41825.03 |
+1.6% | -$824.36 | | 2010 | $40281.99 | +1.8% | $41120.53 |
+1.7% | -$838.54 | | 2009 | $39850.78 | +1.1% | $40564.35 |
+1.4% | -$713.56 | | 2008 | $38664.96 | +3.1% | $39526.14 |
+2.6% | -$861.17 | | 2007 | $37371.34 | +3.5% | $38265.45 |
+3.3% | -$894.11 |
 |
|
| Reference Date: 1st Quarter 2016 |
| Top Areas For This Occupation |
|
|
|

| |


