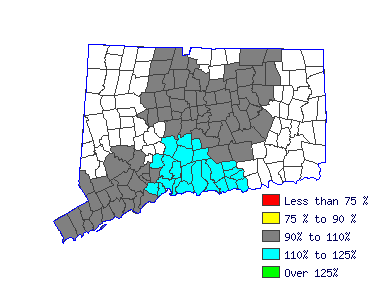
| Plan and design land areas for such projects as parks and other recreational facilities, airports, highways, hospitals, schools, land subdivisions, and commercial, industrial, and residential sites. |
 |
| Mean Wage History |
| Year | This
Occupation | Compared to
Occupational Group | Difference |
| Current | $34.33 | | $41.67 |
| -$7.34 |
| 2015 | $33.46 | +2.6% | $40.61 |
+2.6% | -$7.15 |
| 2014 | $32.83 | +1.9% | $39.85 |
+1.9% | -$7.01 |
| 2013 | $32.20 | +1.9% | $39.09 |
+1.9% | -$6.88 |
| 2012 | $31.58 | +2.0% | $38.33 |
+2.0% | -$6.75 |
| 2011 | $31.09 | +1.6% | $37.73 |
+1.6% | -$6.64 |
| 2010 | $30.54 | +1.8% | $37.07 |
+1.8% | -$6.53 |
| 2009 | $30.22 | +1.1% | $36.68 |
+1.1% | -$6.46 |
| 2008 | $29.32 | +3.1% | $35.58 |
+3.1% | -$6.26 |
| 2007 | $28.34 | +3.5% | $34.39 |
+3.5% | -$6.05 |
| Year | This
Occupation | Compared to
All Occupations | Difference |
| Current | $34.33 | | $22.30 |
| $12.03 |
| 2015 | $33.46 | +2.6% | $21.68 |
+2.9% | $11.78 |
| 2014 | $32.83 | +1.9% | $21.21 |
+2.2% | $11.62 |
| 2013 | $32.20 | +1.9% | $20.78 |
+2.1% | $11.42 |
| 2012 | $31.58 | +2.0% | $20.43 |
+1.7% | $11.15 |
| 2011 | $31.09 | +1.6% | $20.11 |
+1.6% | $10.98 |
| 2010 | $30.54 | +1.8% | $19.77 |
+1.7% | $10.77 |
| 2009 | $30.22 | +1.1% | $19.50 |
+1.4% | $10.71 |
| 2008 | $29.32 | +3.1% | $19.00 |
+2.6% | $10.31 |
| 2007 | $28.34 | +3.5% | $18.40 |
+3.3% | $9.94 |
 |
|
| Reference Date: 1st Quarter 2016 |


