Connecticut's Overall Economy Sends Mixed Signals in 2019
By Jungmin Charles Joo, Research Analyst, Department of Labor
Employment fell in Connecticut for the first time since 2010 and the overall economy weakened in 2019. After having increased for eight straight years, the revised annual average total nonfarm employment fell slightly last year, although the unemployment rate continued to fall since 2011. While real personal income continued to increase for the last six years, the value of the annual diffusion index of 58 state economic indicators dropped to the lowest level since 2010, indicating a slowing but still positive level of growth.
Nonfarm Employment
After our latest annual revision (based on annual average, not seasonally adjusted data), in 2019 Connecticut actually lost employment for the first time since 2010 (-3,300 jobs, -0.2%). In 2018, 2,600 jobs were created (+0.2%). By contrast, employment grew much faster in the nation (1.6% in 2018 and 1.4% in 2019). Employment growth appears to be slowing nationally and in our neighbor states partially due to very low unemployment rates.
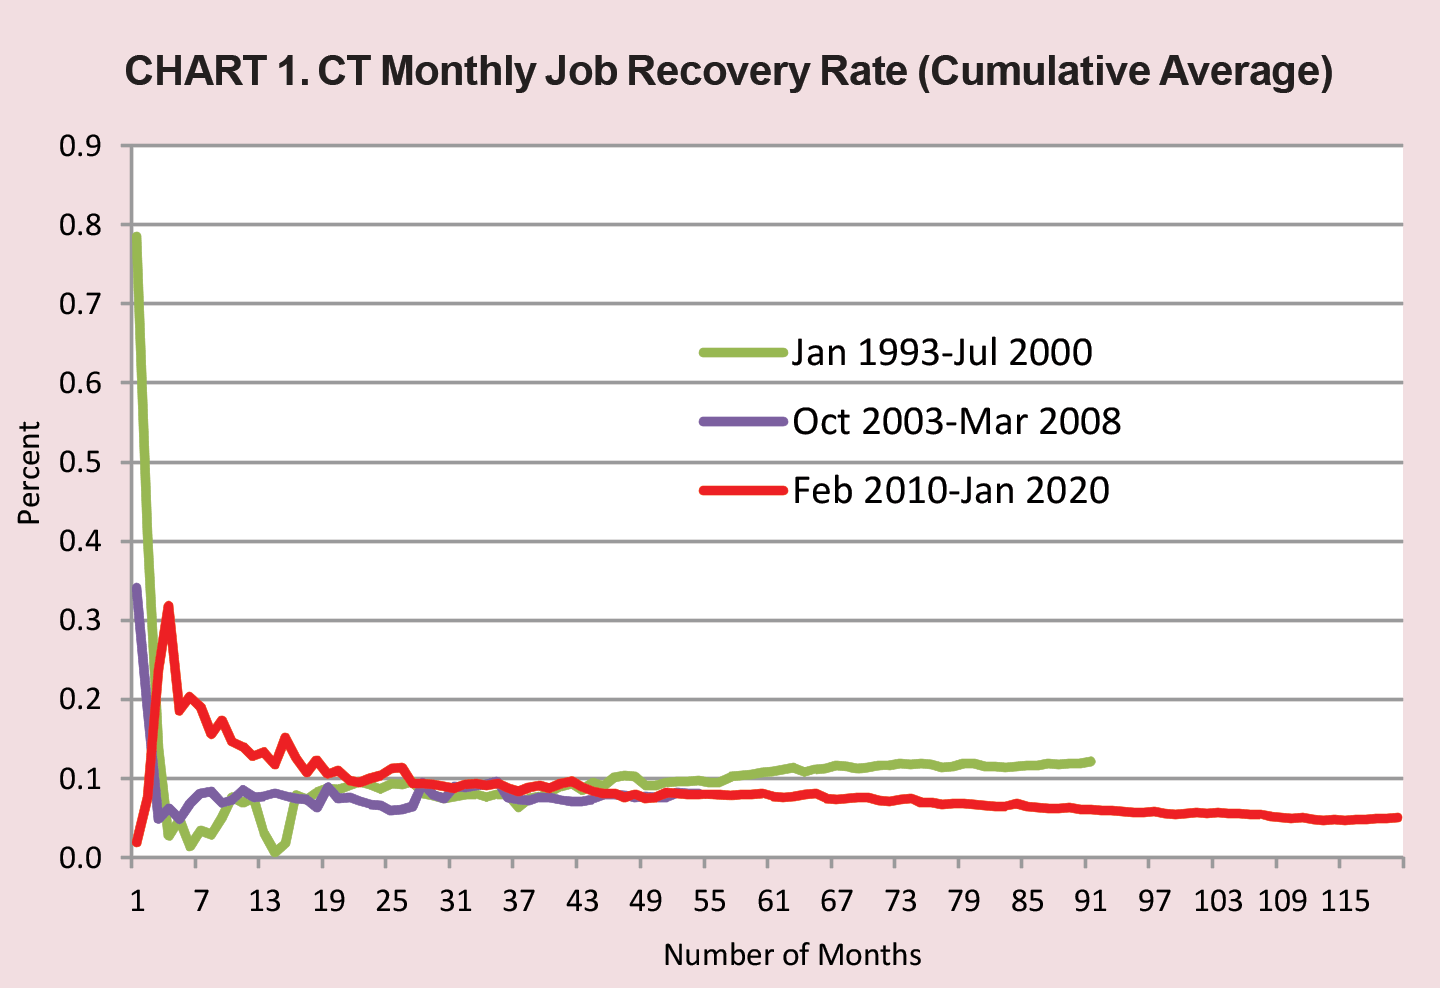
The past three years of Connecticut’s employment recovery has been the slowest of the last eight years. In fact, the current 2010-2020 monthly job recovery rate has been trending downward, averaging below 0.1 percent throughout most of the 120-month employment recovery period to date. In contrast, the 2003-2008 recovery period showed a rising recovery rate, and during the 1993-2000 period, the monthly job growth rate rose steadily, increasing above the 0.1 percent threshold in later years of its employment recovery (Chart 1). Slowing growth rates should be expected this long into a recovery.
Unemployment
On a positive note, unemployment indicators point to a healthier labor market situation. Local Area Unemployment Statistics (LAUS) were again revised back to 2010, due to changes in one of the input components, nonfarm employment. The annual average unemployment rate has trended downward over the past nine years, with last year’s 3.7% being the lowest since 2001 (3.1%). Meanwhile, the nation’s rate fell from 3.9% in 2018 to 3.7% in 2019.
In addition, the U-6 rate, a broader measure of labor underutilization which also includes those who are marginally attached workers and part-timers that want full-time work, fell from 8.9% in 2018 to 7.9% in 2019 for the state, the lowest rate since 2006’s 7.8%. Moreover, the number of average weekly initial claims for unemployment dropped further in 2019 (3,443) for the eighth straight year to the lowest level since 2000 (3,426). Also, the insured unemployment rate fell for the tenth consecutive year to 2.02% in 2019, the lowest rate since 2000 (1.77%).
Employment by Industry
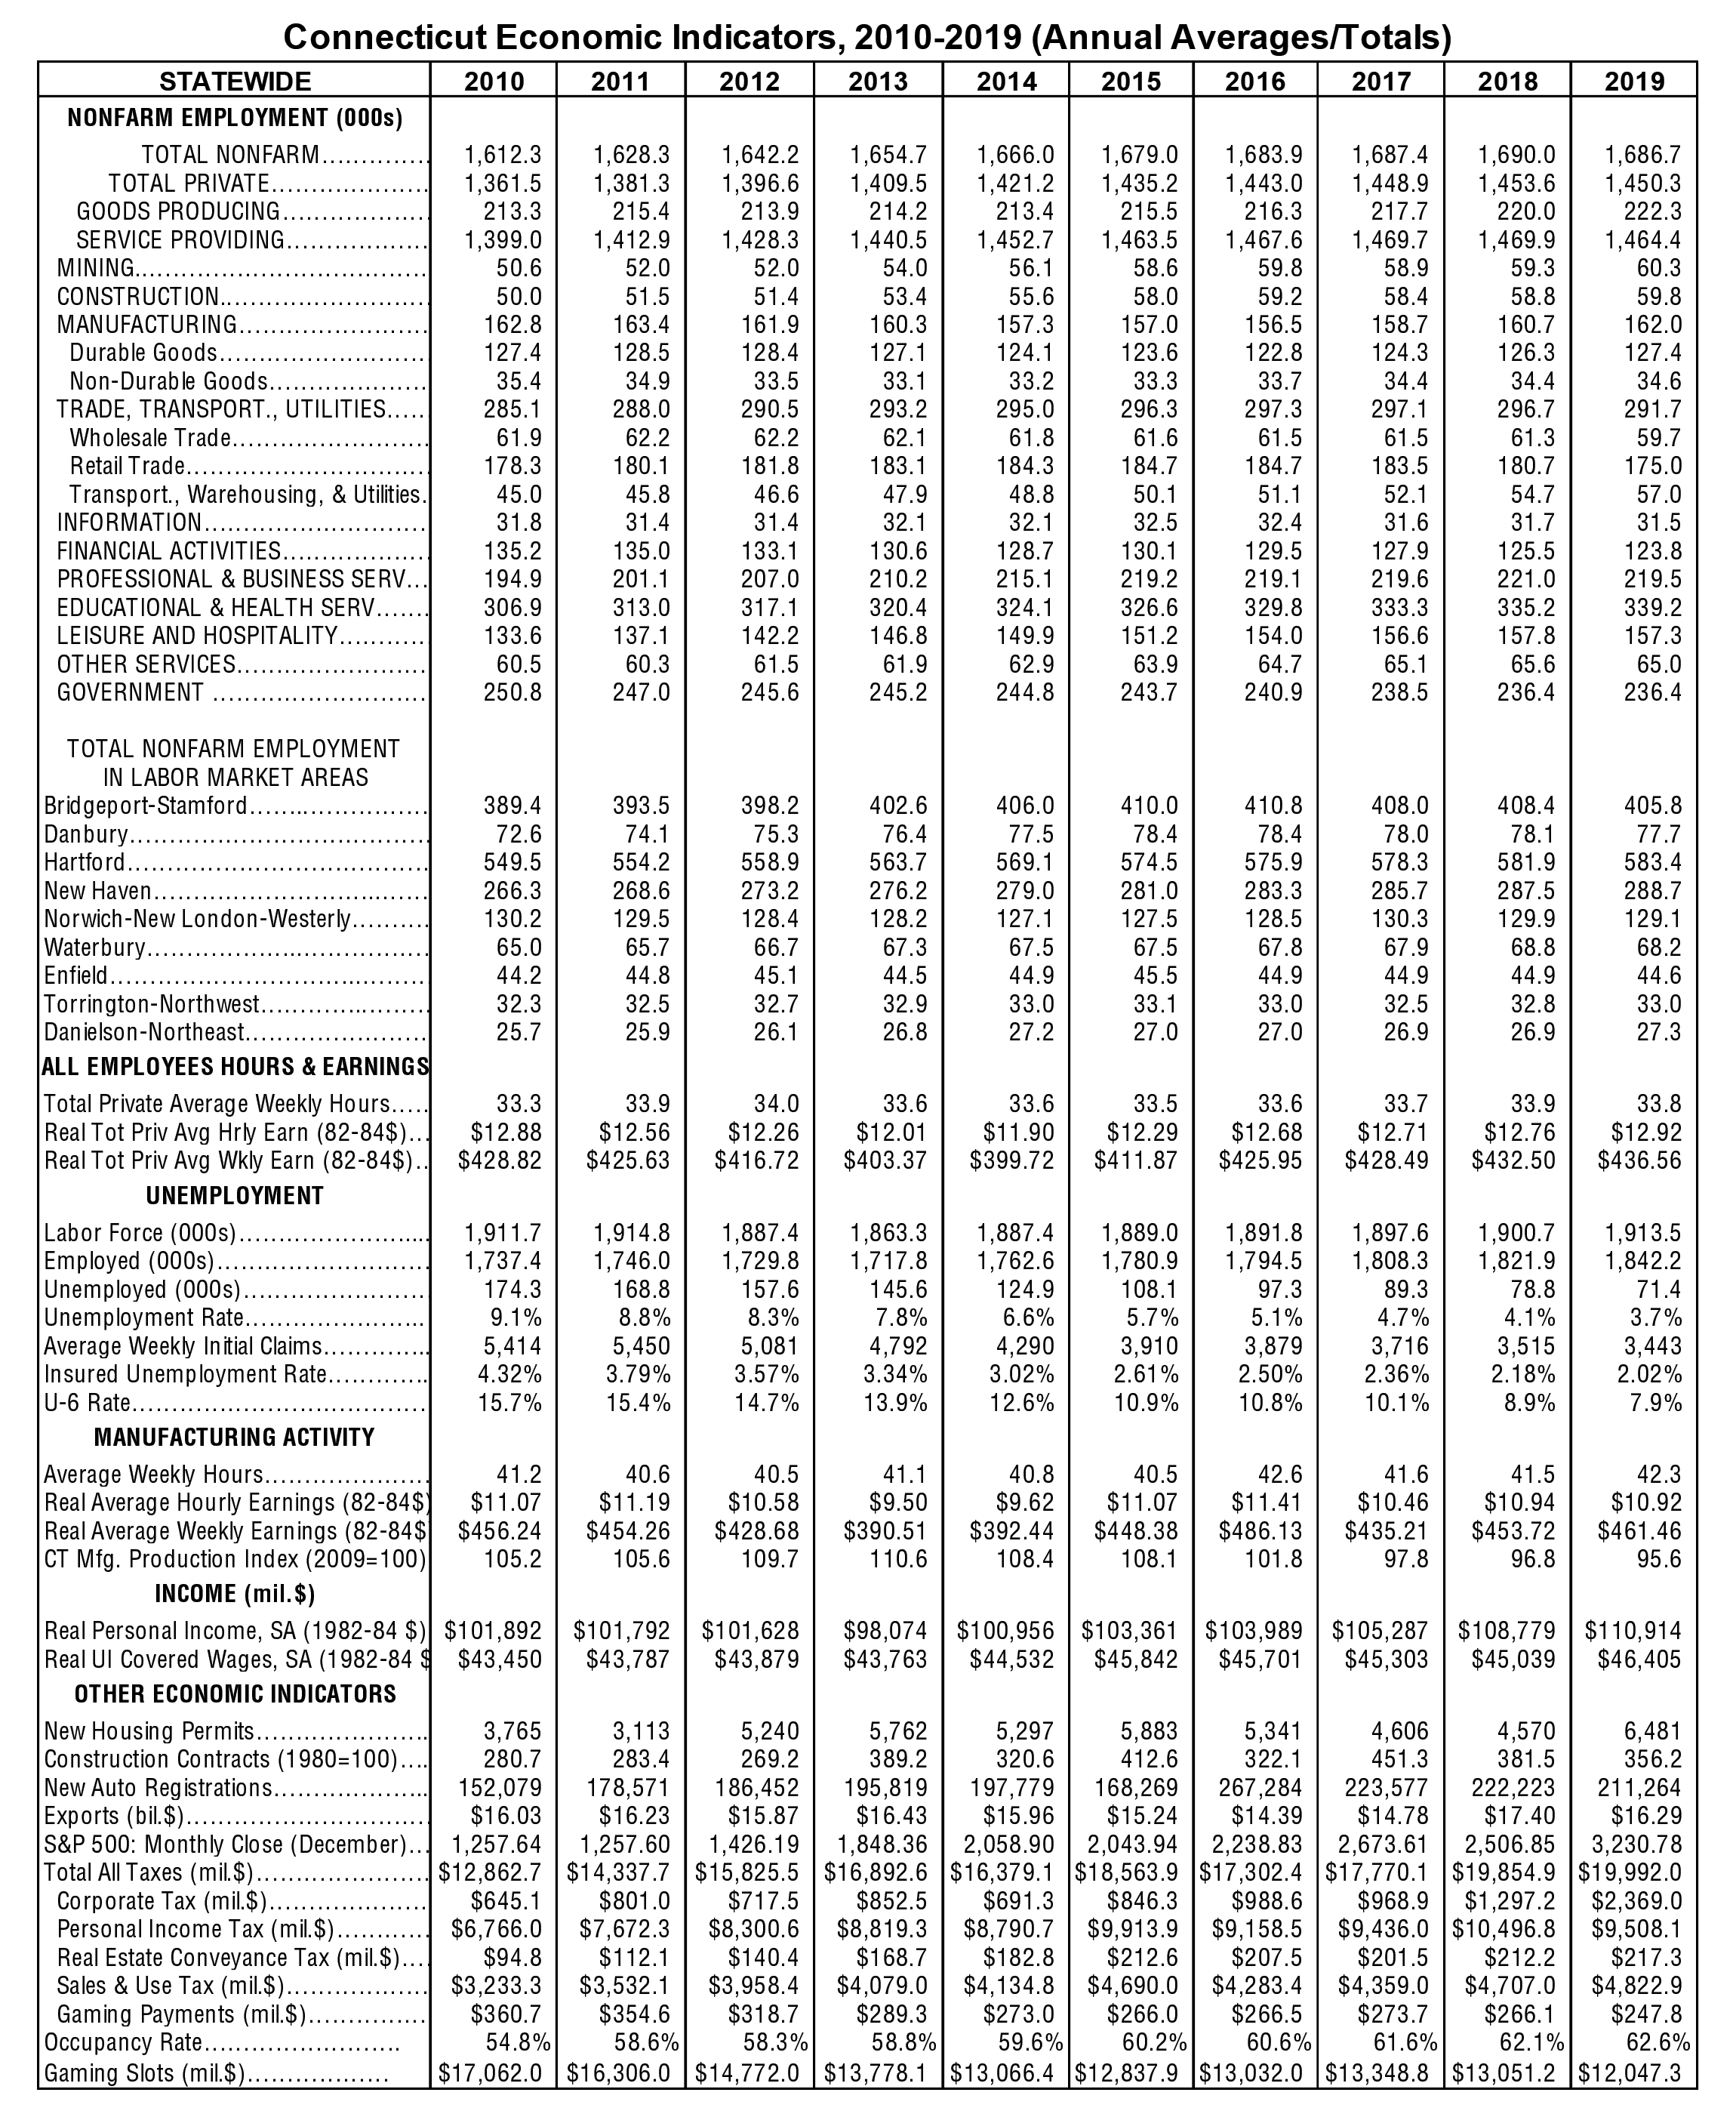
As shown in the table below, Connecticut has lost jobs in 2019. Seven of the ten major industry sectors shed jobs over the year, whereas only three sectors lost jobs in 2018. All sectors, except mining and construction, manufacturing, and educational and health services, lost employment last year. Educational and health services continued to add jobs and led the job growth (1.2%), while manufacturing employment grew for the third year (0.8%).
On the other hand, trade, transportation, and utilities sector has lost jobs three years in a row, and experienced the fastest employment decline (-1.7%) from 2018. Financial activities sector has lost jobs for the fourth year. After having shed jobs every year since 2009, the government sector employment broke even in 2019.
Employment by LMA
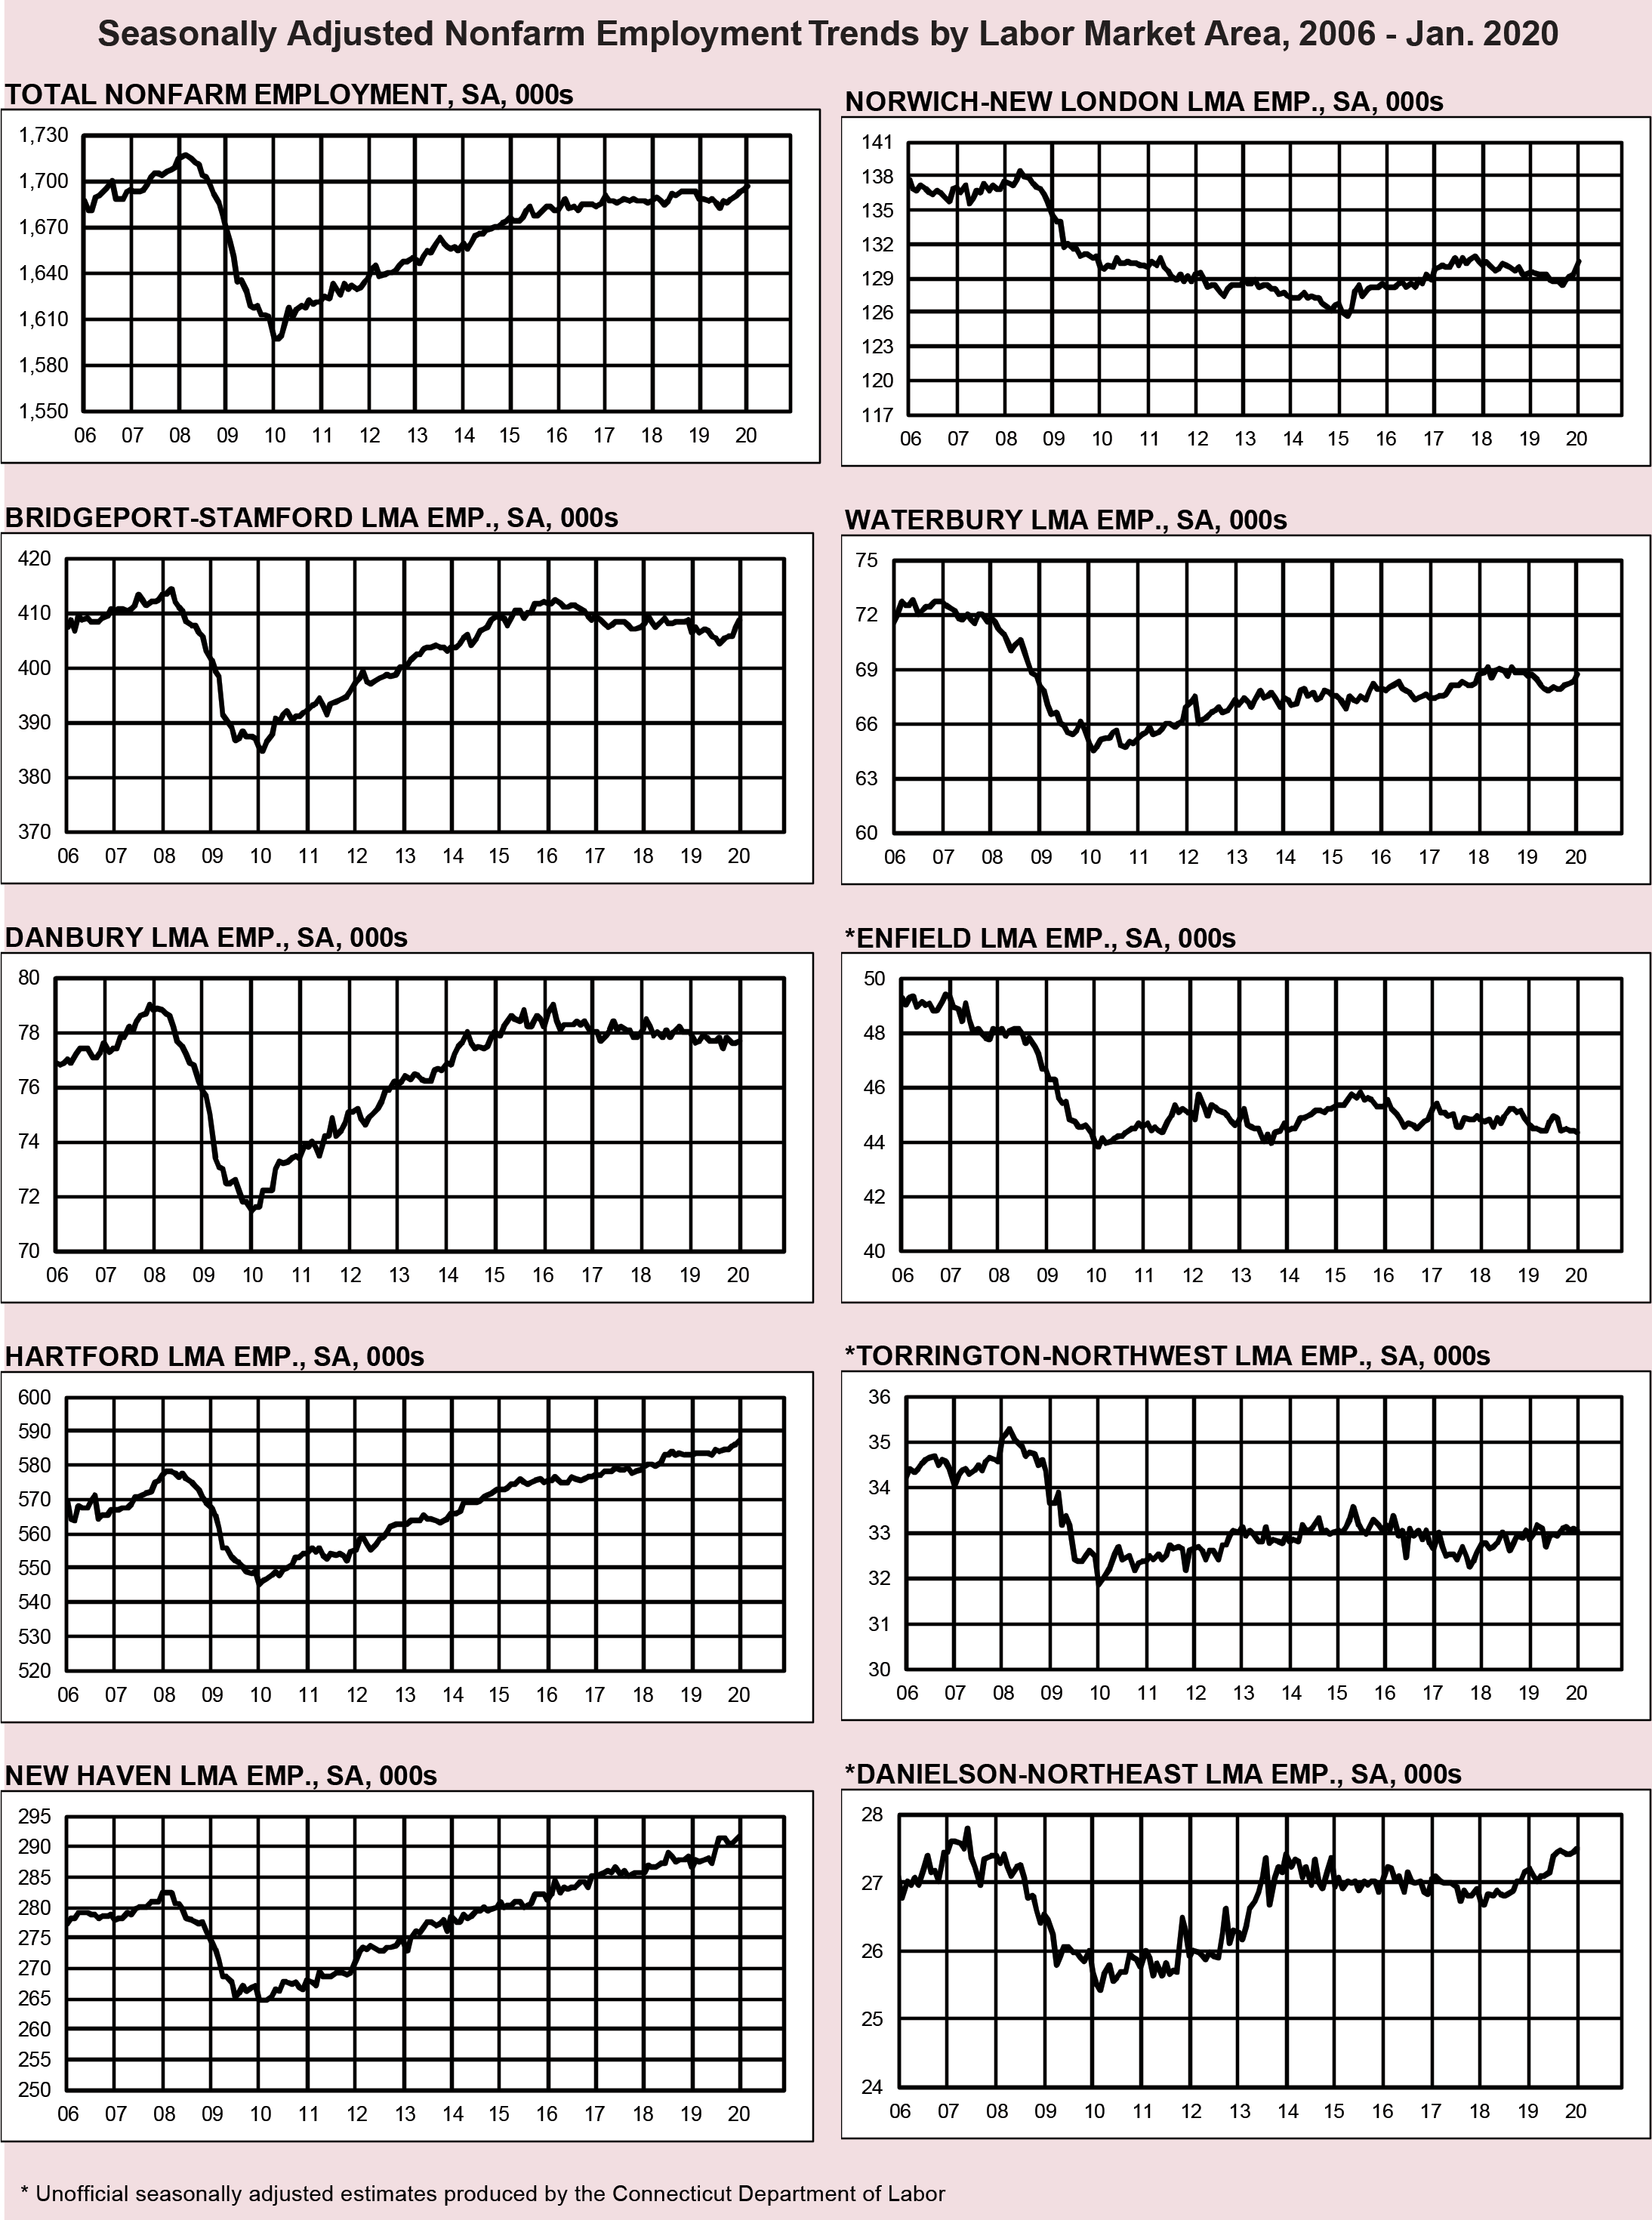
In 2019, five of nine labor market areas (LMAs) in Connecticut lost employment, up from only one in 2018. The biggest job decline occurred in the Bridgeport-Stamford LMA, while the Norwich-New London-Westerly region lost employment for the second year. The charts on page 4 also show long-term seasonally adjusted total nonfarm employment trends of Connecticut and all its nine LMAs from 2006 to January 2020.
Other Economic Indicators
In addition to employment and unemployment data, other economic indicators showed mixed results again last year. The good news is that, as the table on page 3 shows, inflation-adjusted total personal income of state residents rose for six consecutive years, and real Unemployment Insurance covered wages finally turned around in 2019, after three years of decline. New housing permits number, the stock market, and total taxes collected all rose over the year. Real GDP was also stronger through the first three quarters of 2019 than for the same period in 2018.
However, the construction contracts index, the new auto registrations total, exports, revenues from both gaming payments and slots all fell in 2019.
Annual Diffusion Index
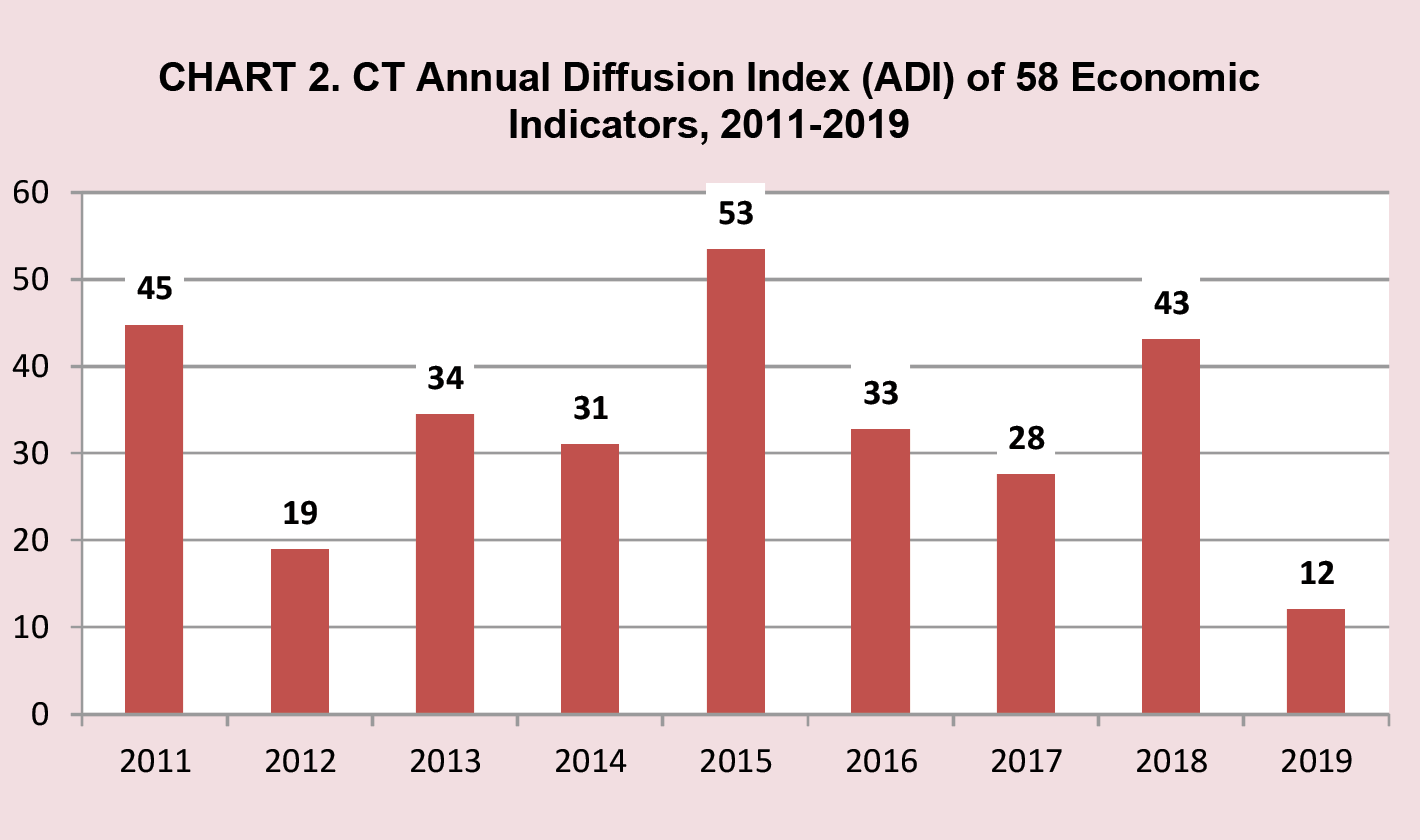
An Annual Diffusion Index (ADI) is one way to measure overall economic activity by summarizing all 58 economic indicators on page 3. For each economic indicator, the movement is up, down, or unchanged over the year. Results are reported as a diffusion index that is calculated by subtracting the share of indicators with negative economic movement from the share that moved in a positive economic direction.
For example, out of 58 indicators, 42 (72%) went up and 16 (28%) went down in 2011. The ADI is then calculated by subtracting 28 from 72, resulting in an indicator of 45. If an ADI is positive, then that is generally interpreted as an expansion in economic activity (because more indicators are improving), while negative values are interpreted as a contraction (because more indicators are deteriorating) for that year. As Chart 2 shows, the ADI fell from 43 in 2018 to 12 in 2019, the lowest level seen over the nine-year period, suggesting a slowing of growth.
Looking Ahead
This year is off to a good start with a gain of 2,600 jobs and a low unemployment rate of 3.7% in January. More new jobs are expected this year and in the near future. For example, it was announced in the media that General Dynamics Electric Boat, a submarine manufacturer based in Groton, will be hiring thousands of employees over the next ten years.
However, given the current coronavirus situation and its potential global economic impact coupled with already weakened state economy, the future economic growths of both the nation and Connecticut remain uncertain.
 |


