Disability and Employment
By Al Sylvestre, Research Analyst, Department of Labor
As the private-sector labor market has recovered more jobs than it lost in the 2008-2010 recession, people with disabilities, who comprise five percent of the state workforce, continue integrating with the labor market. This article takes a brief look at the economic geography of people with disabilities showing where they live, the economic sectors in which they work, and how their earnings compare with those of their non-disabled peers. Programs and services that provide opportunities for people with disabilities to attach to the labor force and retain employment are briefly discussed as well.
Population and Geography
The US Census Bureau’s American Community Survey (ACS) 2017 five-year average statistics show that 3.43% of working people with disabilities have one or more disabilities. This includes 0.71% of the employed work force with a vision impairment or legal blindness. About 86% of people with disabilities have a physical impairment including hearing loss or an ambulatory disability. People with one or more disabilities have self-care difficulties (6.5% of disabled workers), independent living difficulty (16.7%), or cognitive difficulty (33.1%).
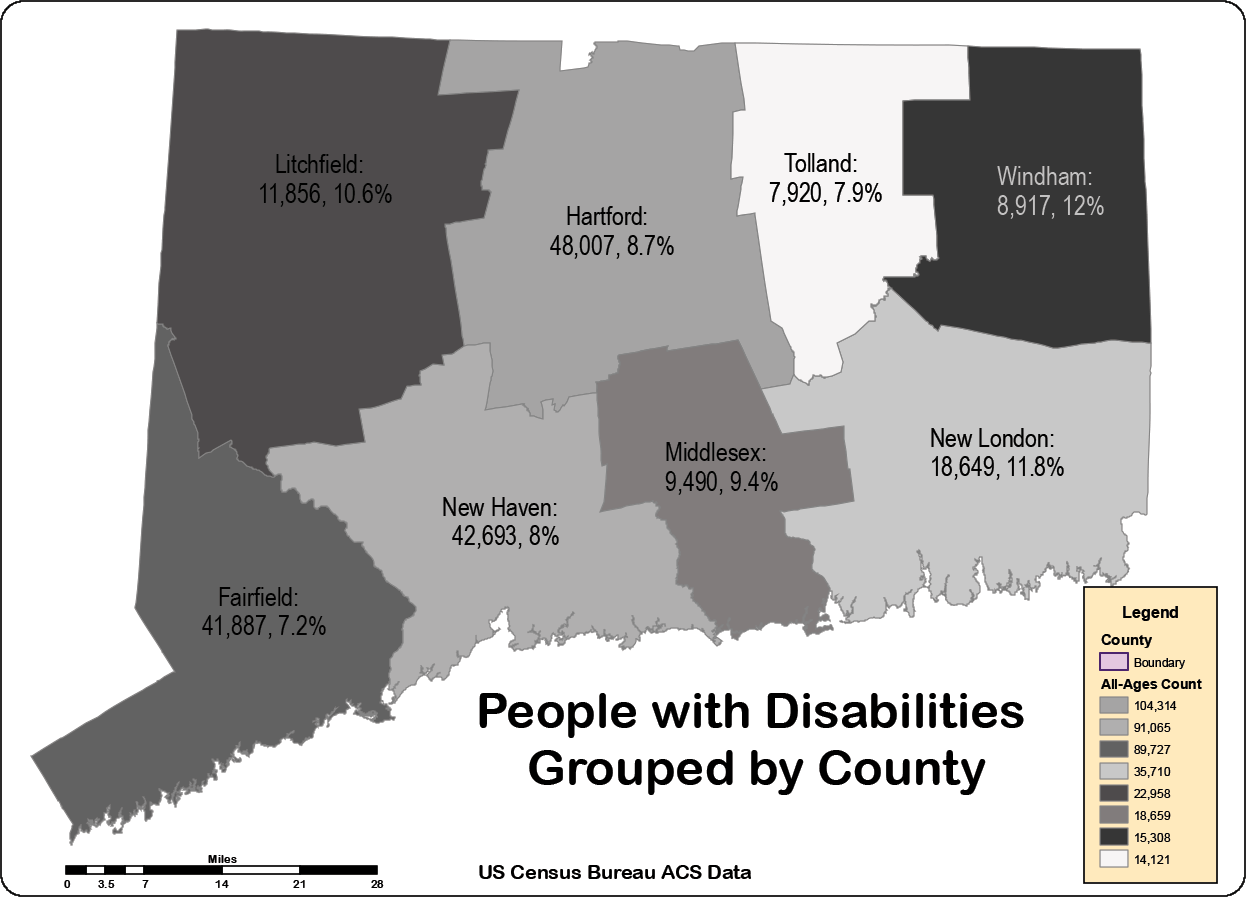
ACS data show that 26.2% of Connecticut residents with disabilities call Hartford County home while 22.9% reside in Fairfield County, and 23.2% live in New Haven County. The distribution of these residents is shown on the map (above) with the working age population ratio they represent. About three-fourths (72.3%) of this population lives in counties with robust public transit close to vocational rehabilitation (VR) services. Though it is home to a pair of cities—New London and Norwich—New London County’s access to public benefits is compromised by inadequate public transportation for the 9.11% of state residents with disabilities living there. Reaching out to the 5.9%, 3.6%, and 3.9% of disabled persons in rural Litchfield, Tolland, and Windham Counties is a challenge given those counties’ paucity of public transit. The transit-supply challenge in suburban Middlesex County with 4.8% people with disabilities is less one of supply than distance.
Economic Characteristics
ACS data show that people with disabilities are disproportionally represented in Connecticut’s service-sector economy—except in Windham County where the ratios are 20.6% to 19.7%. A higher proportion of the non-disability workforce is engaged in management positions than its peers with disabilities: from a 12.7 percentage-point differential in Hartford County to a low of 5.7 points in Windham County. Employment sectors that include low-skills occupations are near parity between employees with and without disabilities.
Regarding journeys to work, higher percentages of people with disabilities commute by ride sharing or mass transit. People with disabilities are 10.5% less likely to drive to work alone. They are 9.6% more likely to work at home, 47.7% more likely to take a cab, motorcycle, or lift-equipped van, and 18.7% more likely to take the bus or train compared with their non-disabled peers.
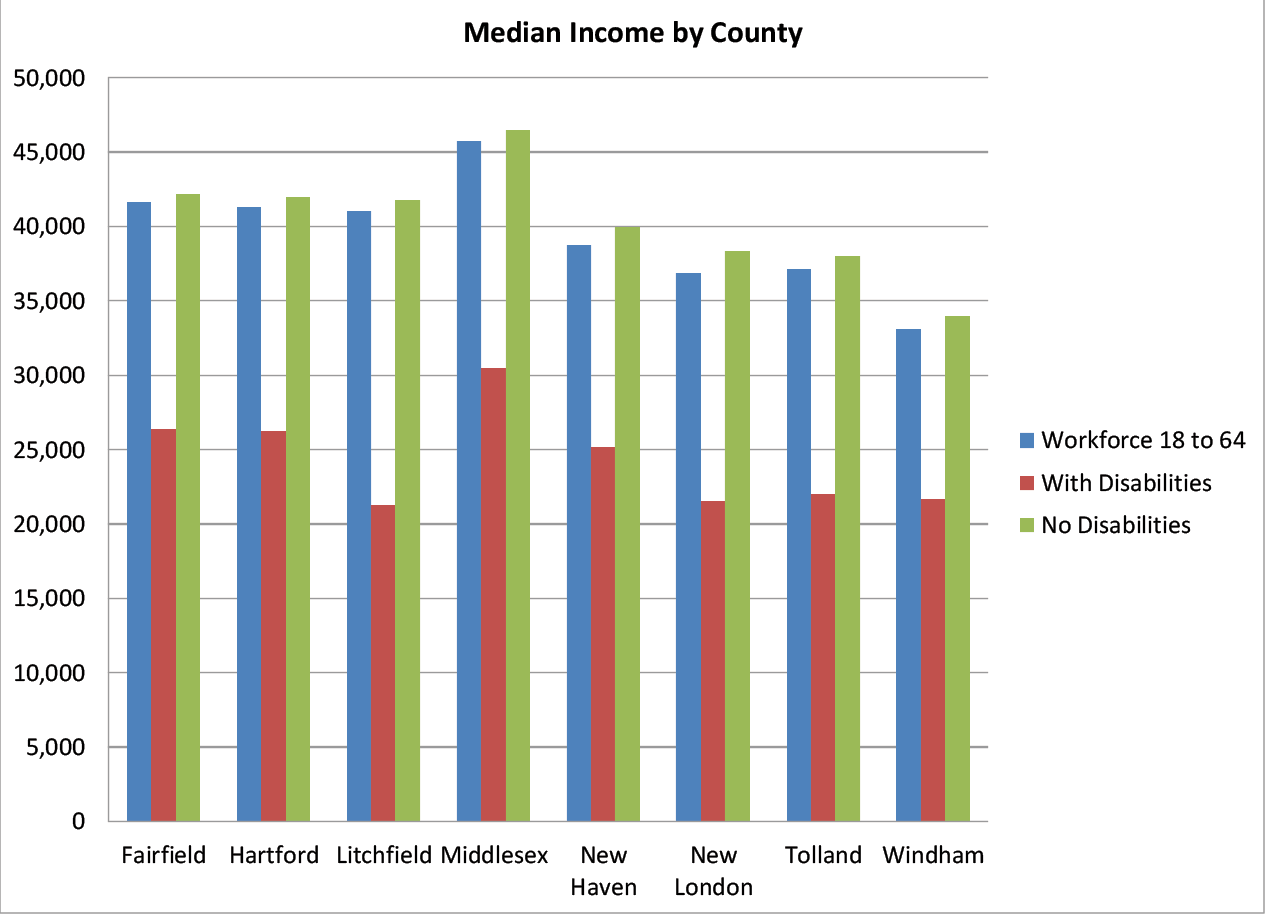
ACS data in the accompanying table show that highest per capita earners with disabilities live in Middlesex County with $30,474 in median annual income earning sixty-three cents for every dollar earned by people reporting no disability. While median income for people in the state workforce ranges from Windham County’s $33,078 to $45,732 in Middlesex County, people with disabilities earn between 51.8 and 66.6 cents for every per-capita dollar earned by the rest of the workforce. Compared to non-disabled persons, people with disabilities earn between 50.9 and 63.7 cents on the dollar. Median income for people with disabilities is closest to workforce median for public-transit-rich Fairfield, Hartford, and New Haven counties. Though Middlesex County has lower transit availability for people who work outside traditional business hours, its median earnings for people with disabilities compared to the entire workforce is 5%, 4.8% and 1.4% closer to the median than Fairfield, Hartford, and New Haven counties.
Programs and Services
Overcoming employment barriers and economic disparities between people with and without disabilities requires public VR and post-secondary education opportunities that include apprenticeship. Geographic isolation exacerbated by inequitable transportation access is the most significant barrier people with disabilities must overcome. Consistent access to transportation modes is provided through the Department of Aging and Disability Services (ADS), workforce-development boards, commissions, and non-profit agencies. They help fill transportation gaps to benefit persons with disabilities and low-income earners. The Advisory Board for Persons Who are Blind or Visually Impaired and the Connecticut Bicycle and Pedestrian Advisory Board find better access to transportation systems by enabling the development of non-motorized transportation to supplement public transportation systems of buses, trains, and ride-sharing services.
Conclusion
Opportunities for people with disabilities to participate in Connecticut’s economy and improve their standards of living continue to expand as VR programs with the help of workforce boards and improved employer understanding of the benefits of hiring and retaining workers with disabilities combine to improve the employment outlook for this segment of Connecticut’s workforce.
 |


