Connecticut Town Economic Indexes Rose Higher in 2018
By Jungmin Charles Joo, Department of Labor and Dana Placzek, Research, Department of Labor
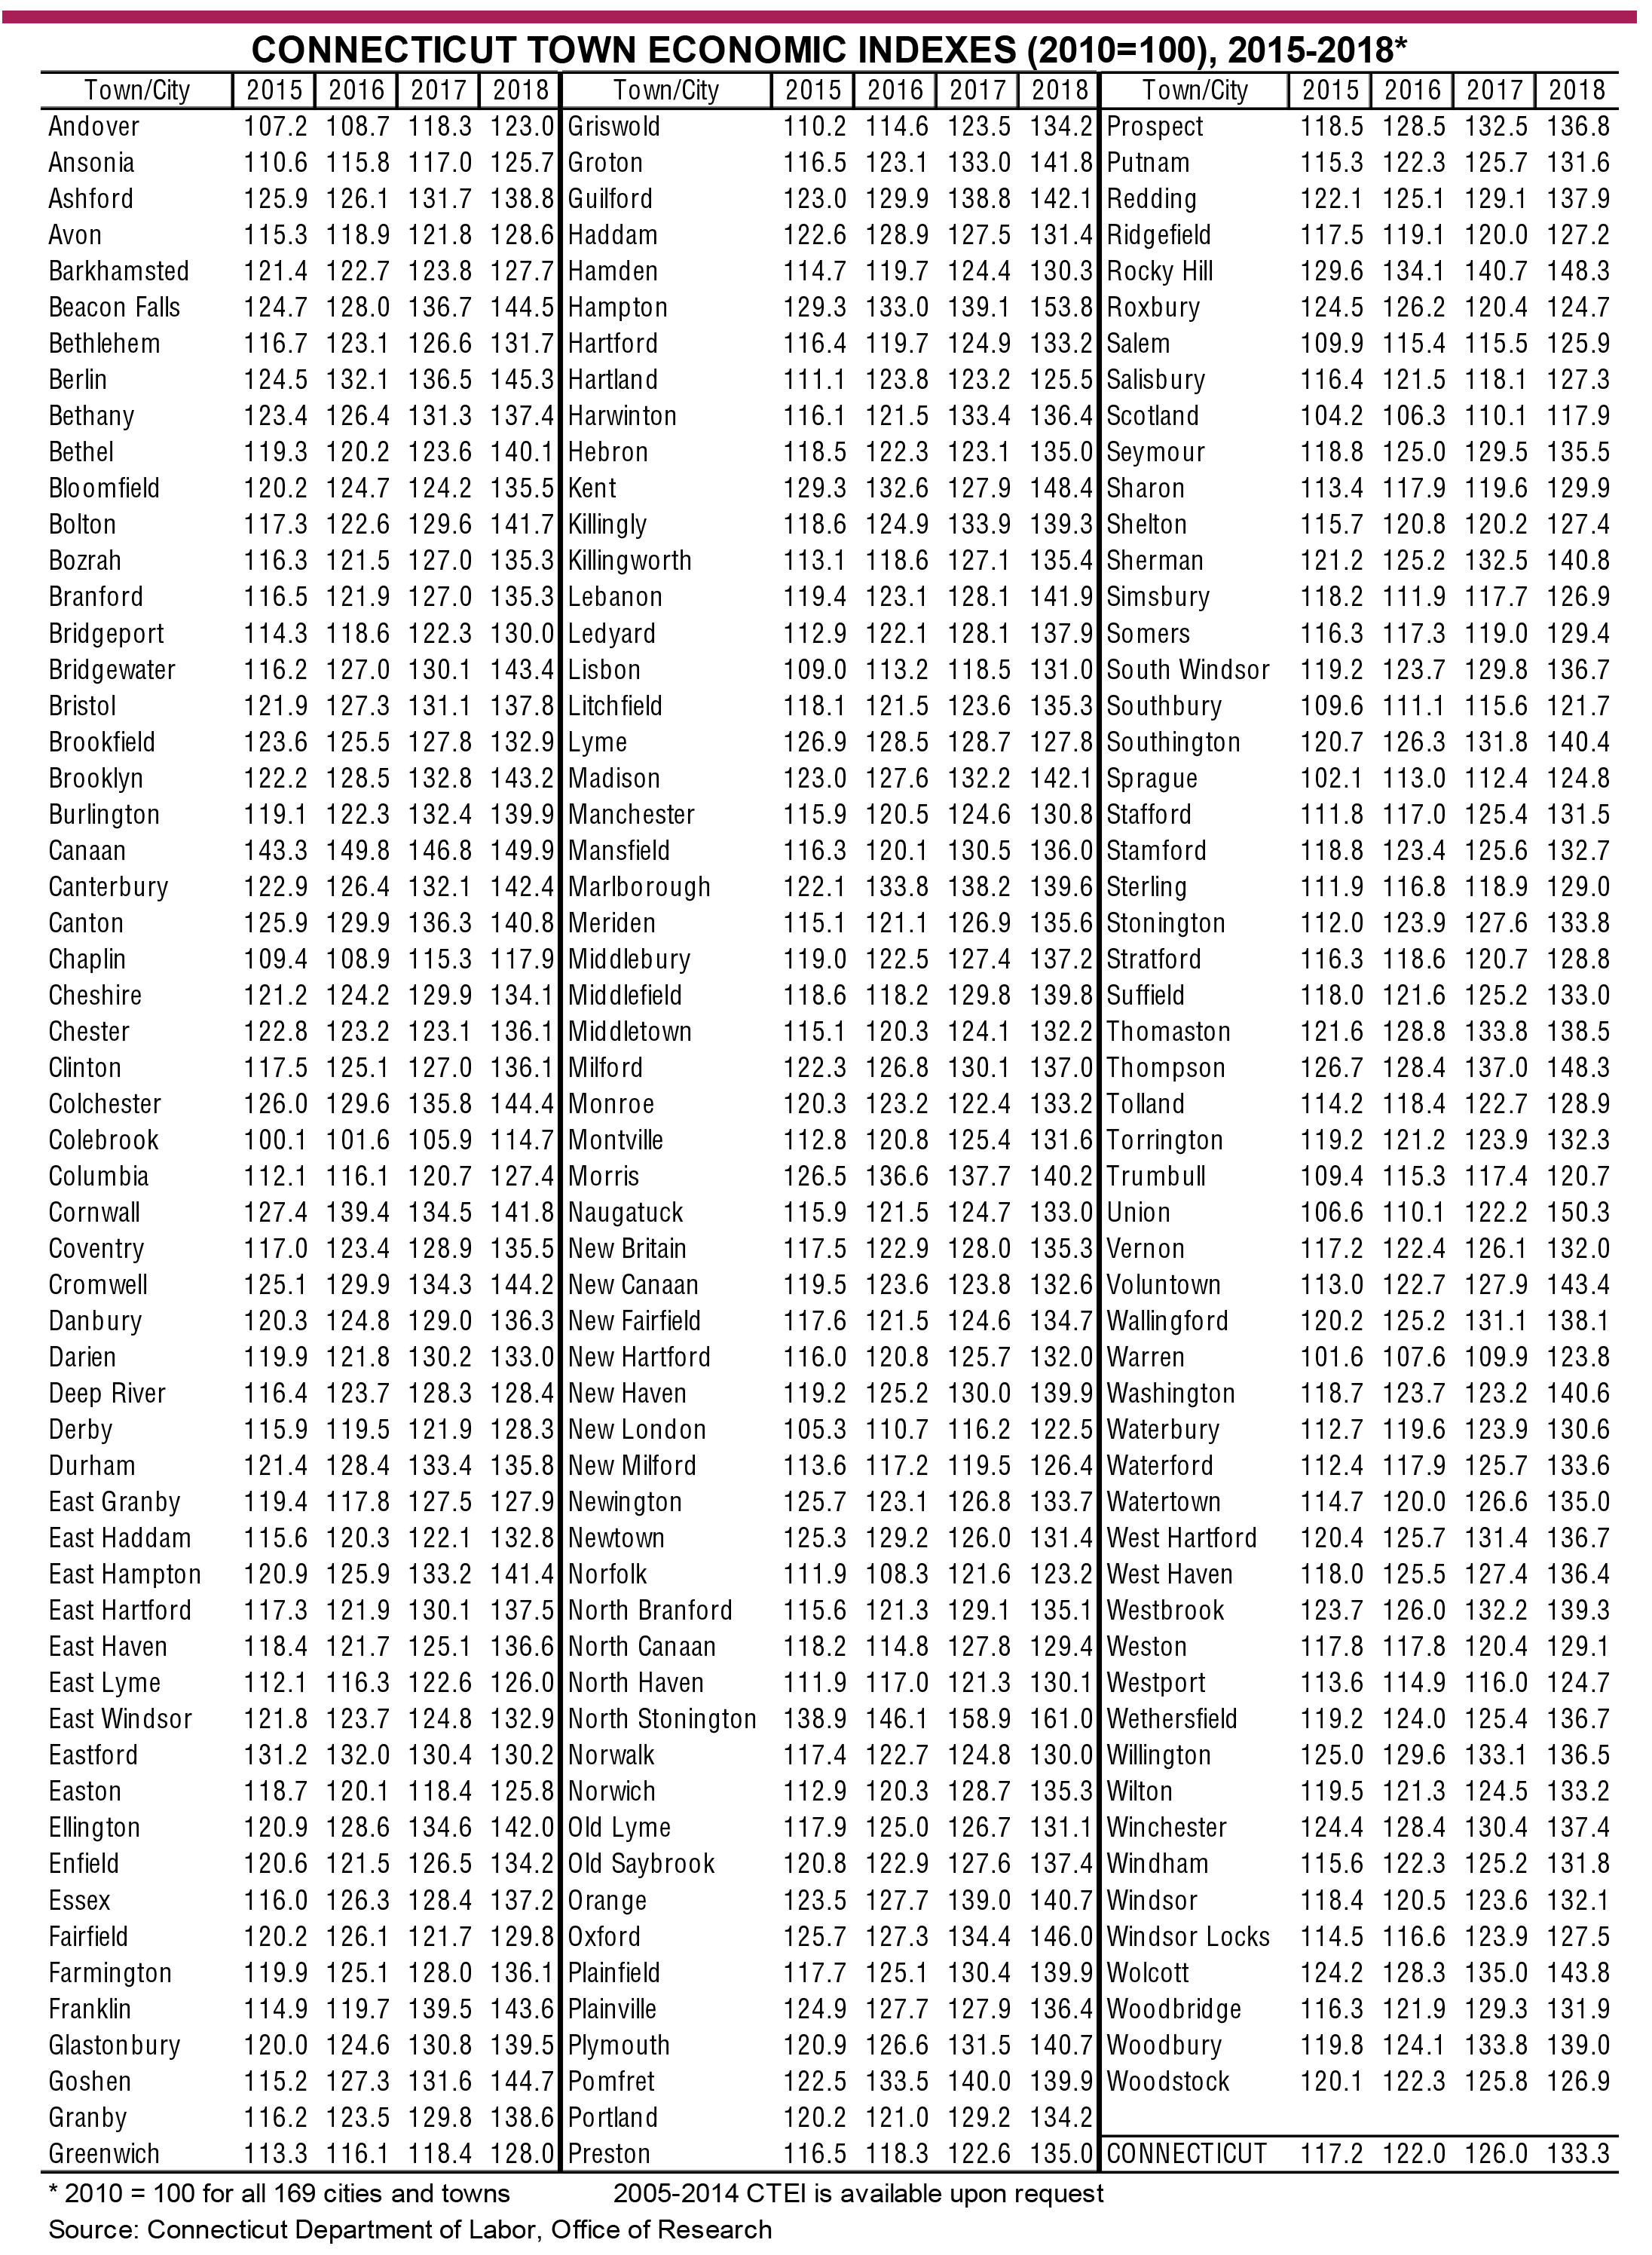
 onnecticut’s overall economy bounced back strongly in 2018 after having slowed down in 2016 and 2017, based on the index performances of cities and towns. The indexes on page 3 give a broad measure of business and resident economic well-being of each town, allowing comparisons among them.
The CTEI Methodology
The Connecticut Town Economic Indexes (CTEI) were introduced four years ago and are released annually. The Connecticut Department of Labor’s Office of Research developed the composite indexes of all 169 municipalities in the state to measure each town or city’s overall economic health, which then can be ranked and compared to others to gain perspective. Four annual average town economic indicators were used as components, which are total covered business establishments, total covered employment, inflation-adjusted covered annual average wages, and the unemployment rate.
Establishments are the physical work units located in the municipality. Employment is the number of employees on payroll in the establishments that are located in the town. Wages are the aggregate payroll pay divided by the total average employment. These three measures come from the Quarterly Census of Employment and Wages (QCEW) program and include all those who are covered under the unemployment insurance law, thus capturing nearly 100 percent of all the employees in each town.
Establishments, employment and wages are proxy for each municipality’s business activities and its overall economic strength, while the unemployment rate measures the overall economic health of its residents. Each of the four components was given a 25 percent weight. The CTEI’s base year is 2010, which equals 100. The wage component was adjusted to 2010 dollars and unemployment rate changes were inversed to reflect the right economic direction. By combining these four major economic indicators, the index allows comparisons among towns.
CTEI: 2017 to 2018
Reflecting an ongoing economic recovery, 166 cities and/or towns saw business and labor market conditions improve, while three worsened. Because the town sizes can vary greatly, a same change in one index value of a small town would not necessarily mean the same degree of economic growth as a large city. Therefore, the comparisons were grouped in three categories: towns with a population (2018) under 25,000, towns or cities with a population between 25,000 and 100,000, and cities with over 100,000.
Among the towns with a population under 25,000, Union and Kent’s overall economy grew the fastest from 2017 to 2018. East Haven and Wethersfield were the two fastest over the year among the towns or cities with a population between 25,000 and 100,000. Of the five largest cities with a population of 100,000 or more, New Haven and Hartford had the fastest overall economic recovery last year.
CTEI: 2010 to 2018
When compared with 2010, when the employment recovery began in Connecticut, all 169 cities and towns’ indexes showed increases in 2018. Among the small towns with residents fewer than 25,000, North Stonington and Hampton experienced the fastest economic growth between 2010 and 2018. Groton and Southington were the two fastest growing towns among those with a population between 25,000 and 100,000.
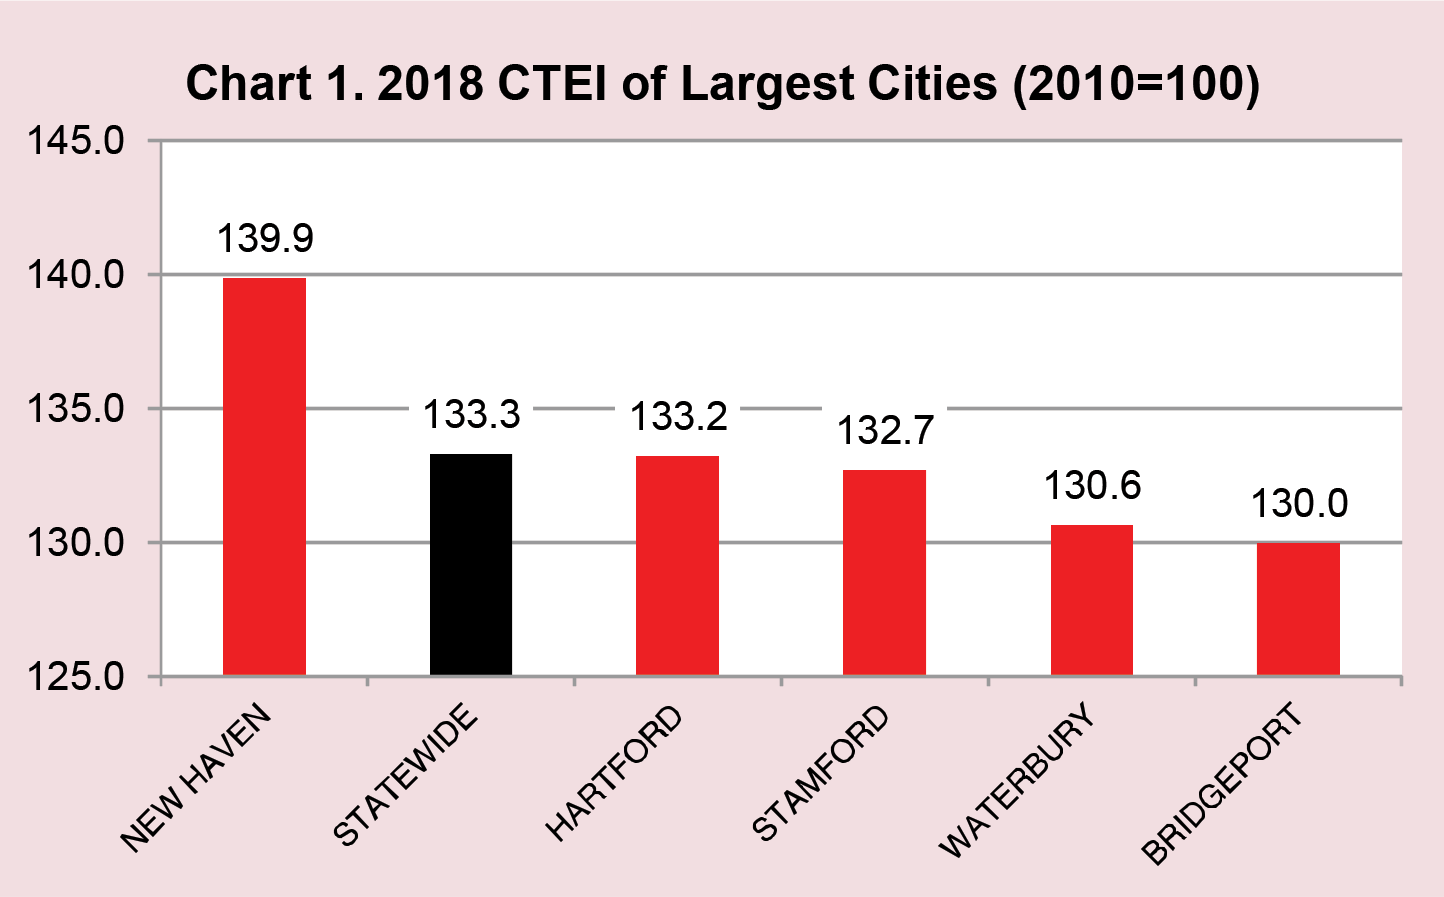
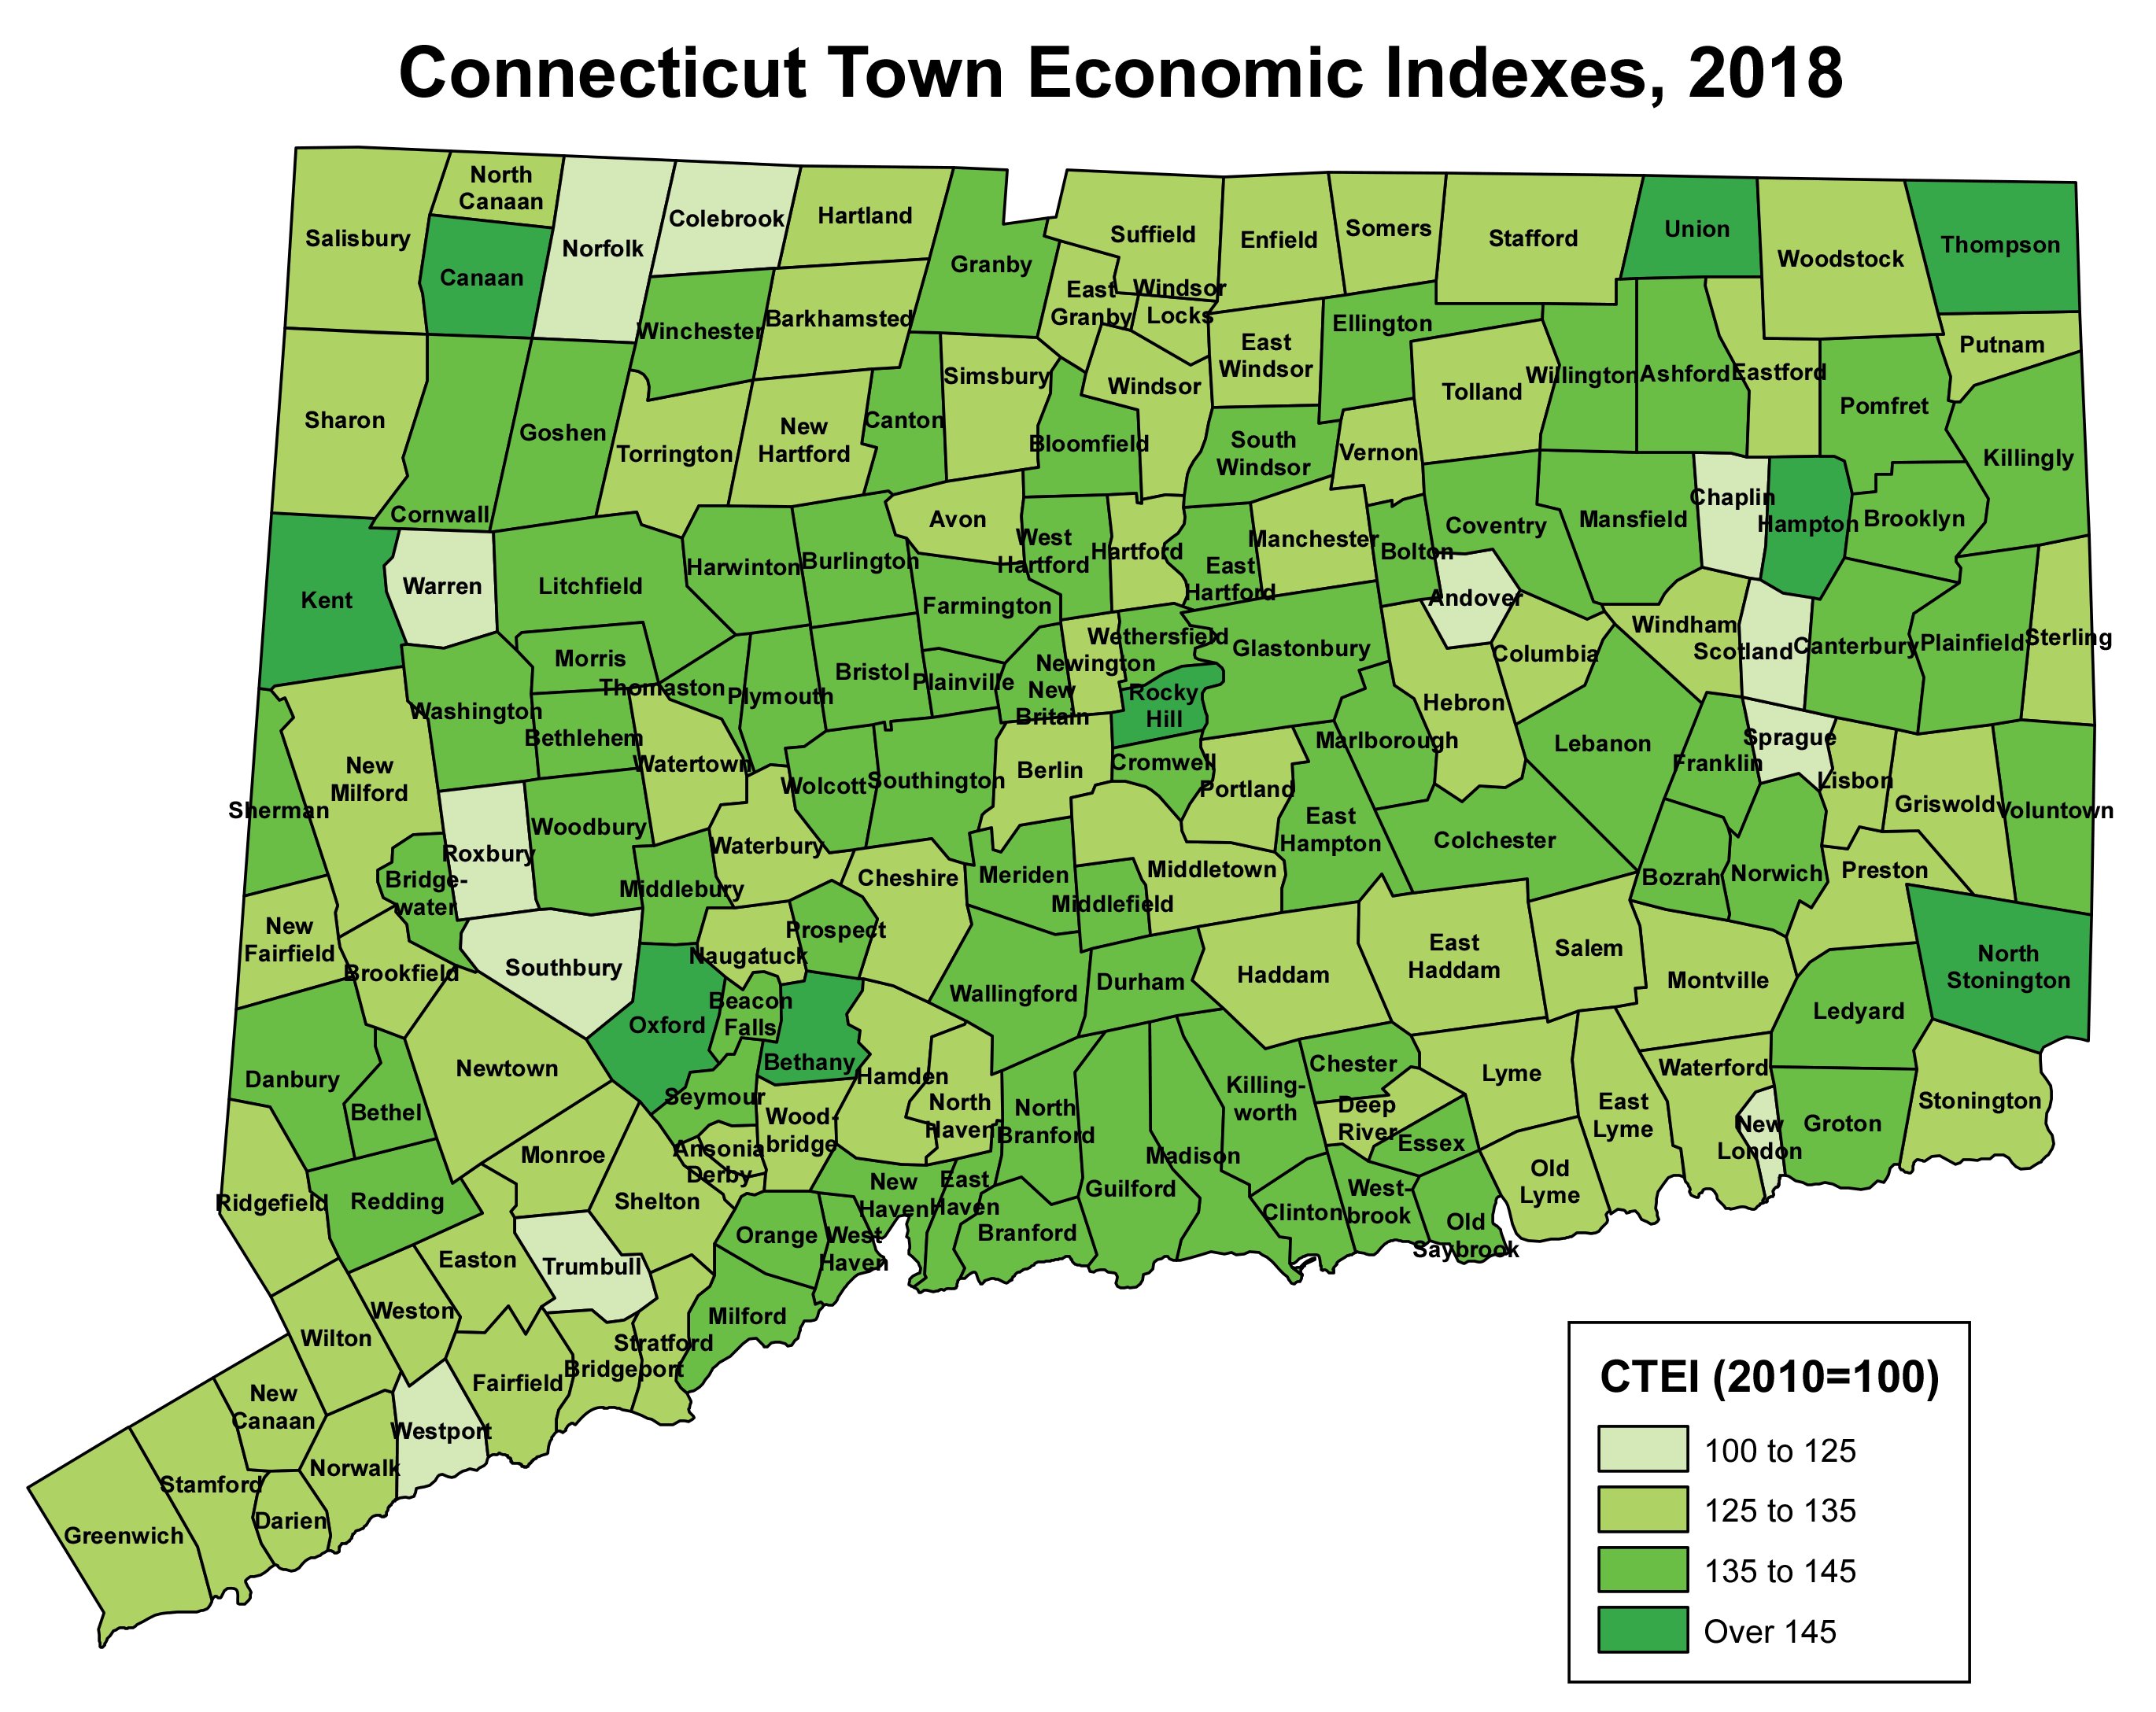
Among the largest cities (population over 100,000), as Chart 1 shows, New Haven and Hartford’s economy grew the most in the last eight years. The map on page 4 also shows the different ranges of economic recovery rate of each municipality in the state.
LMA Indexes: 2010-2018
The index by Labor Market Area (LMA) is the average of all town indexes that make up that labor market area. The index in all nine regions in Connecticut grew from 2010 to 2018. The Danielson-Northeast LMA’s overall economy grew the fastest, followed by the Waterbury and New Haven areas. The Bridgeport-Stamford and Enfield LMA indexes, however, increased at a slower pace than the statewide index.
The Components of CTEI:
Establishments
The total number of business establishments in Connecticut rose by 2.0% to 122,073 from 2017 to 2018, the same growth as the 2.0% from the year before. Stamford continued to dominate, with the largest number of businesses (6,045) of the 169 cities and towns. Since 2010, Connecticut’s overall number of businesses increased 9.7%. Overall, 82% of the total municipalities added new establishments over the year, and 91% since 2010.
Employment
Last year’s average statewide employment rose 0.2% from 2017 and 4.9% from 2010. About 60% of the cities and towns in the state experienced job recovery over the year, higher than 51% from 2016 to 2017. Overall, 72% of the municipalities in the state have added jobs since the employment recovery began in 2010.
Real Wages
In 2018, only 30% of all cities and towns in the state posted inflation-adjusted wage gains over the year, down from 37% in 2017. The statewide real annual average wage was $57,474 per worker, a 1.5% decline over 2017 and a 3.3% decrease from 2010. The highest real average pays were in businesses located in Greenwich at $117,379 last year.
Unemployment Rate
Hartford continued to post the highest unemployment rate (7.0%) last year, a drop from 8.2% in 2017. Overall, the statewide rate fell from 4.7% in 2017 to 4.1% in 2018. For a detailed analysis and the complete table of unemployment rates for all 169 municipalities, see "2018 Unemployment Rate by Town" in the June 2019 issue of the Connecticut Economic Digest.
CTEI Diffusion Index: 2006-2018
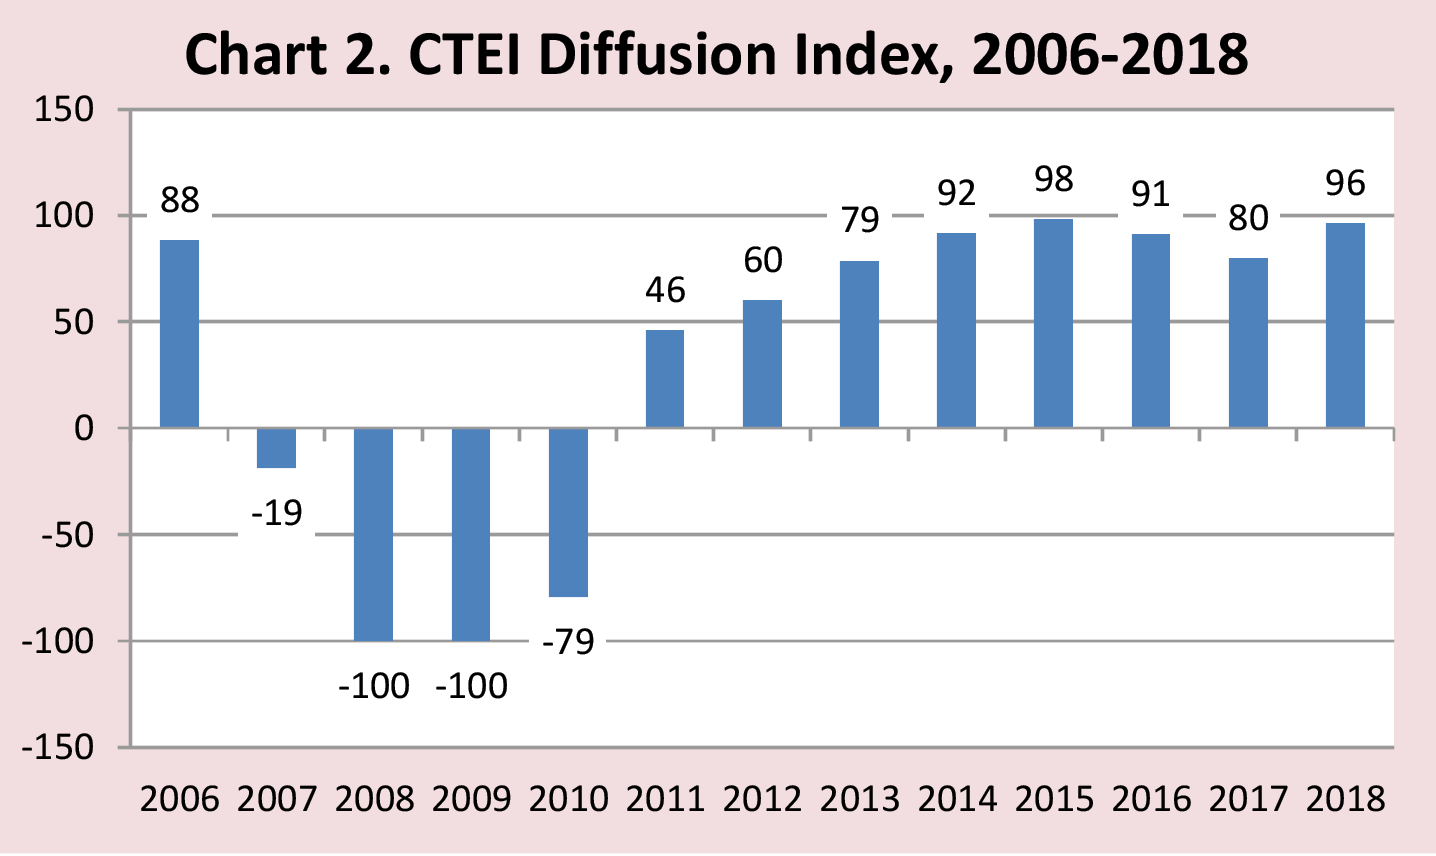
One way to measure aggregate performance of the CTEI of 169 cities and towns in Connecticut is to use a diffusion index. For each town, the index figure is up, down, or unchanged over the year. The diffusion index is calculated by subtracting the share of towns that experienced decreases in their indexes from the share that had increases over the year.
As expected, during the 2008-2010 period, the index values were -100, -100, and -79, respectively, when Connecticut was in an employment downturn. The state economy gradually recovered from 2011, as the diffusion index numbers indicate on Chart 2, and by 2015 nearly all towns were gaining (+98). After slowing down during 2016 and 2017, the index then picked up in 2018 (+96), where 166 towns moved up and only three moved down, making it the second best performance since 2011. Download CTEI 2005-2018 data.xlsx
 |


