
Connecticut’s Short-Term Employment Projections Through 2019
By Matthew Krzyzek, Economist, and Patrick Flaherty, Assistant Director of Research, DOLCurrent Situation
Connecticut is off to a good start in 2018. As reported in the March Digest, Connecticut’s economic recovery slowed in 2017, but the first quarter of 2018 has shown significant job gains. While data are preliminary and subject to significant revision, first quarter employment rose more than 8,700 jobs from the fourth quarter of 2017 and more than 7,200 from the first quarter of 2017. Private sector employment gained 9,400 from the fourth quarter with Health Care & Social Assistance up 2,500 (+3,800 from the first quarter of 2017), Accommodation and Food Services up 1,300 (+900 from the 2017 Q1) and Professional, Scientific, and Technical Services up over 1,000. Manufacturing was a bright spot in 2017 — the first quarter of 2018 was up 5,100 from the first quarter of 2017 with most of the gains in Durable Goods.
In 2017, the average seasonally adjusted monthly jobs gain was just 400 jobs per month compared to 1,500 jobs per month for the first three months of 2018. Though this pace of growth is not likely to continue – and is subject to revision – the Connecticut economy was showing positive momentum as we headed into spring.
Connecticut Compared to Other States
Connecticut has recovered the number of private sector jobs lost during the previous recession. However, over the past six years, Connecticut’s job growth has been significantly slower than the nation’s and that of our neighbor states. Figure 1 shows total nonfarm, private, and government employment from March 2012 to March 2018 for the US, Connecticut, and nearby states. Connecticut’s nonfarm employment is up 3.0 percent over this six-year period with the private sector up 61,900 jobs (4.4%) and government employment down 12,100 jobs or 5.0%.
Sector Change
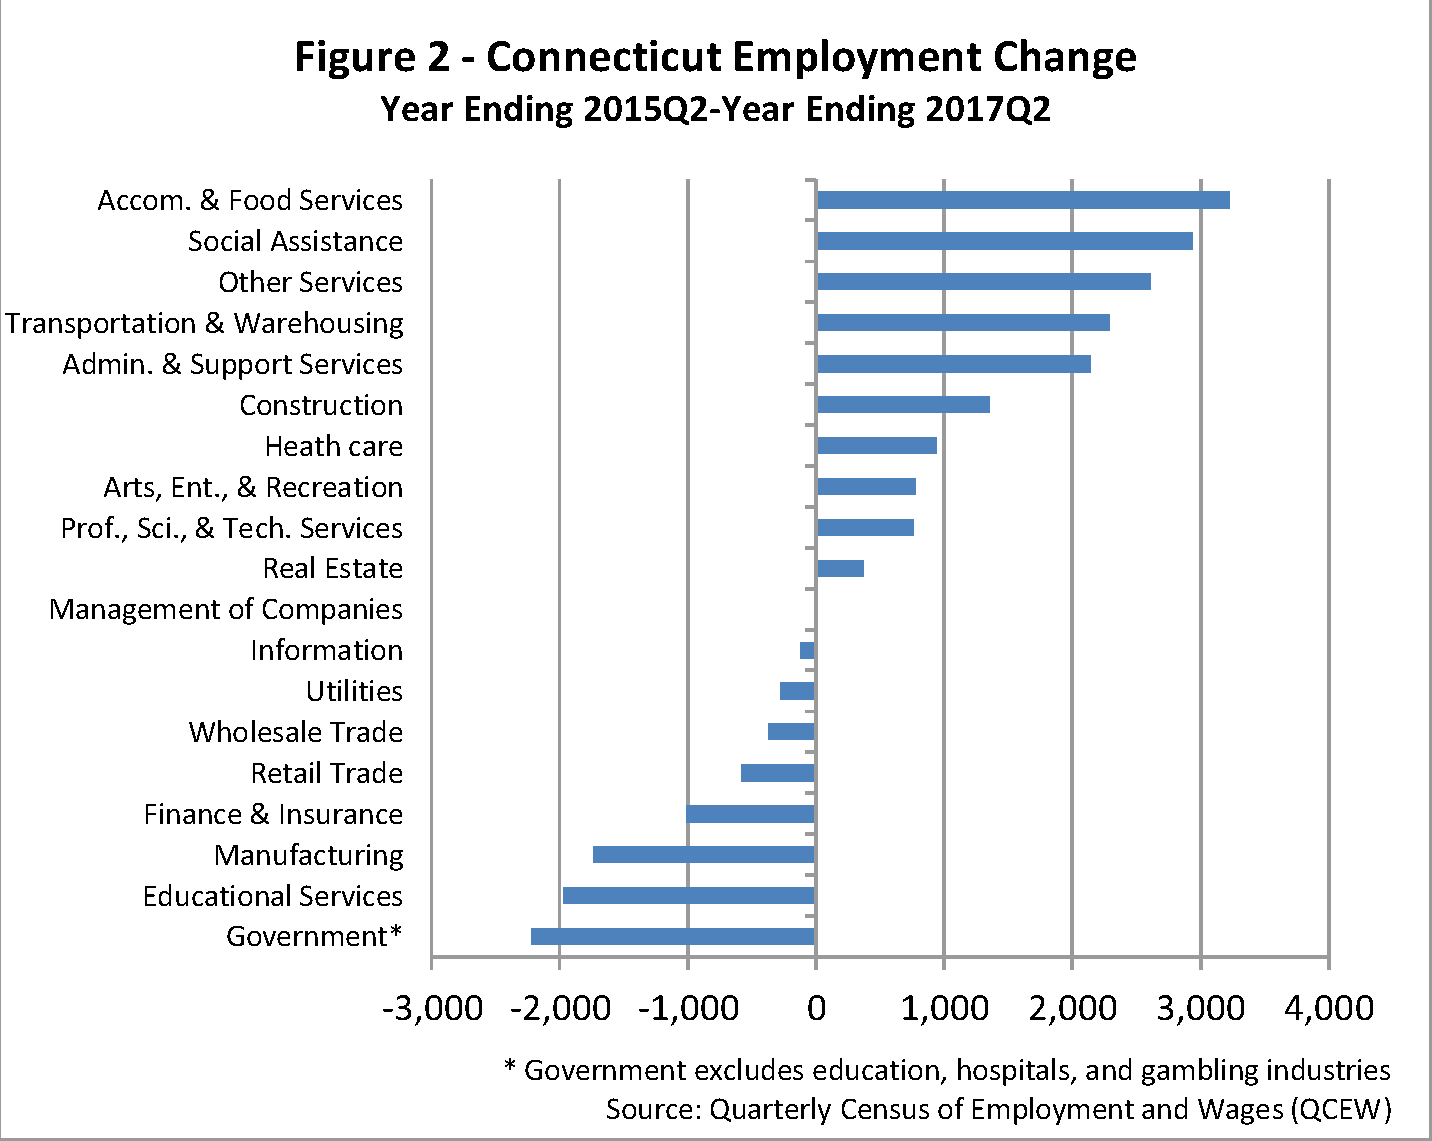
Health Care and Social Assistance makes up the largest combined industry sector in the state (and in all states) comprising over 18 percent of Connecticut employment. This sector has consistently added jobs throughout both the recession and recovery. Growth for that sector has slowed in the most recent two years, particularly for Health Care, but both have continued to add jobs. In the past five years (year ending 2nd Quarter 2012 to 2nd Quarter 2017) Health Care has grown by approximately 5,000 jobs while Social Assistance has added nearly 10,000. This continues a long-term trend; Social Assistance has steadily increased as a share of that combined-sector since the early 1990s. Hospital consolidation in recent years has also contributed to this shift. As shown in Figure 2, Social Assistance has added nearly three times as many jobs as Health Care over the two years ending 2017 Q2.
Accommodation and Food Services is the third largest growing sector and unlike Health Care or Social Assistance, its growth shows few signs of slowing down. It added more than 11,000 jobs from 2012 to 2017, and was the sector with the most job growth during the two years leading up to the short-term projection base quarter of 2017Q2. This shift is consistent with changing consumer preferences and is also occurring at the national level.
Transportation and Warehousing has also seen strong growth in recent years. From 2012 to 2017, the sector has added nearly 5,000 jobs including 2,300 since 2015, largely due to online retailers such as Amazon adding warehouses and distribution centers in the state.
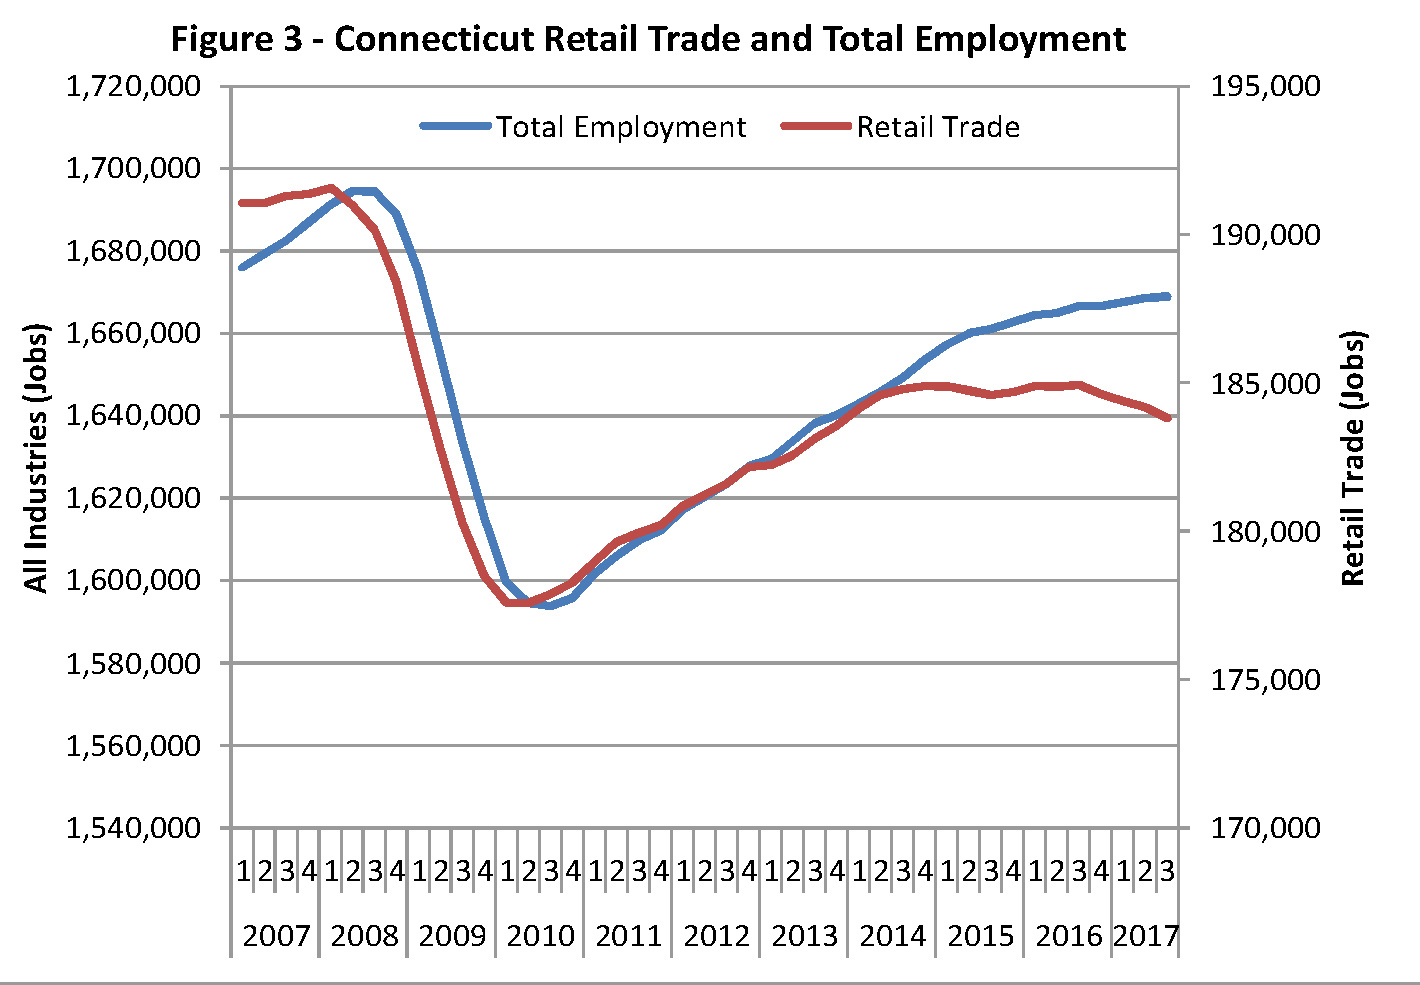
The consumer preference shift to online shopping responsible for the increase in Transportation and Warehousing employment has also negatively impacted Retail Trade. From mid-2010 through late-2014, this sector added jobs and recovered at a rate in line with the overall economy (Figure 3). It held flat at roughly 185,000 jobs until the third quarter of 2016 and has lost employment in every quarter since.
Manufacturing, the sector with the most losses since 2012, is down 8,600 jobs in the five-year period. Losses moderated after severe decreases during the Great Recession and have most recently shown increases. Figure 2 shows Manufacturing losses during the two years that precede the projection. All of the loss was in the first year of the two-year period. Manufacturing jobs increased from 2Q 2016 to 2Q 2017 and have shown further increases since. Manufacturing employment troughed in the fourth quarter of 2016 at 156,431 and is up 1,640 jobs through the third quarter of 2017. Heavy demand from the Civilian and Defense Aerospace industries indicate that this sector will continue to add jobs, marking a turnaround for a sector that had been contracting for decades. 1
Other notable industry changes include the decline in Educational Services employment (public and private) which has long been a sector with employment growth. Its decline during the 2015 to 2017 period was influenced by decreases in school-aged population and state and local budget issues. Post-recession Construction employment peaked in 2016 Q3 and has since held flat, and Government employment continues to decline.
Many of these trends, in particular the very-recent increase in manufacturing employment, are expected to continue over the projection period.
CONNECTICUT SHORT-TERM PROJECTIONS
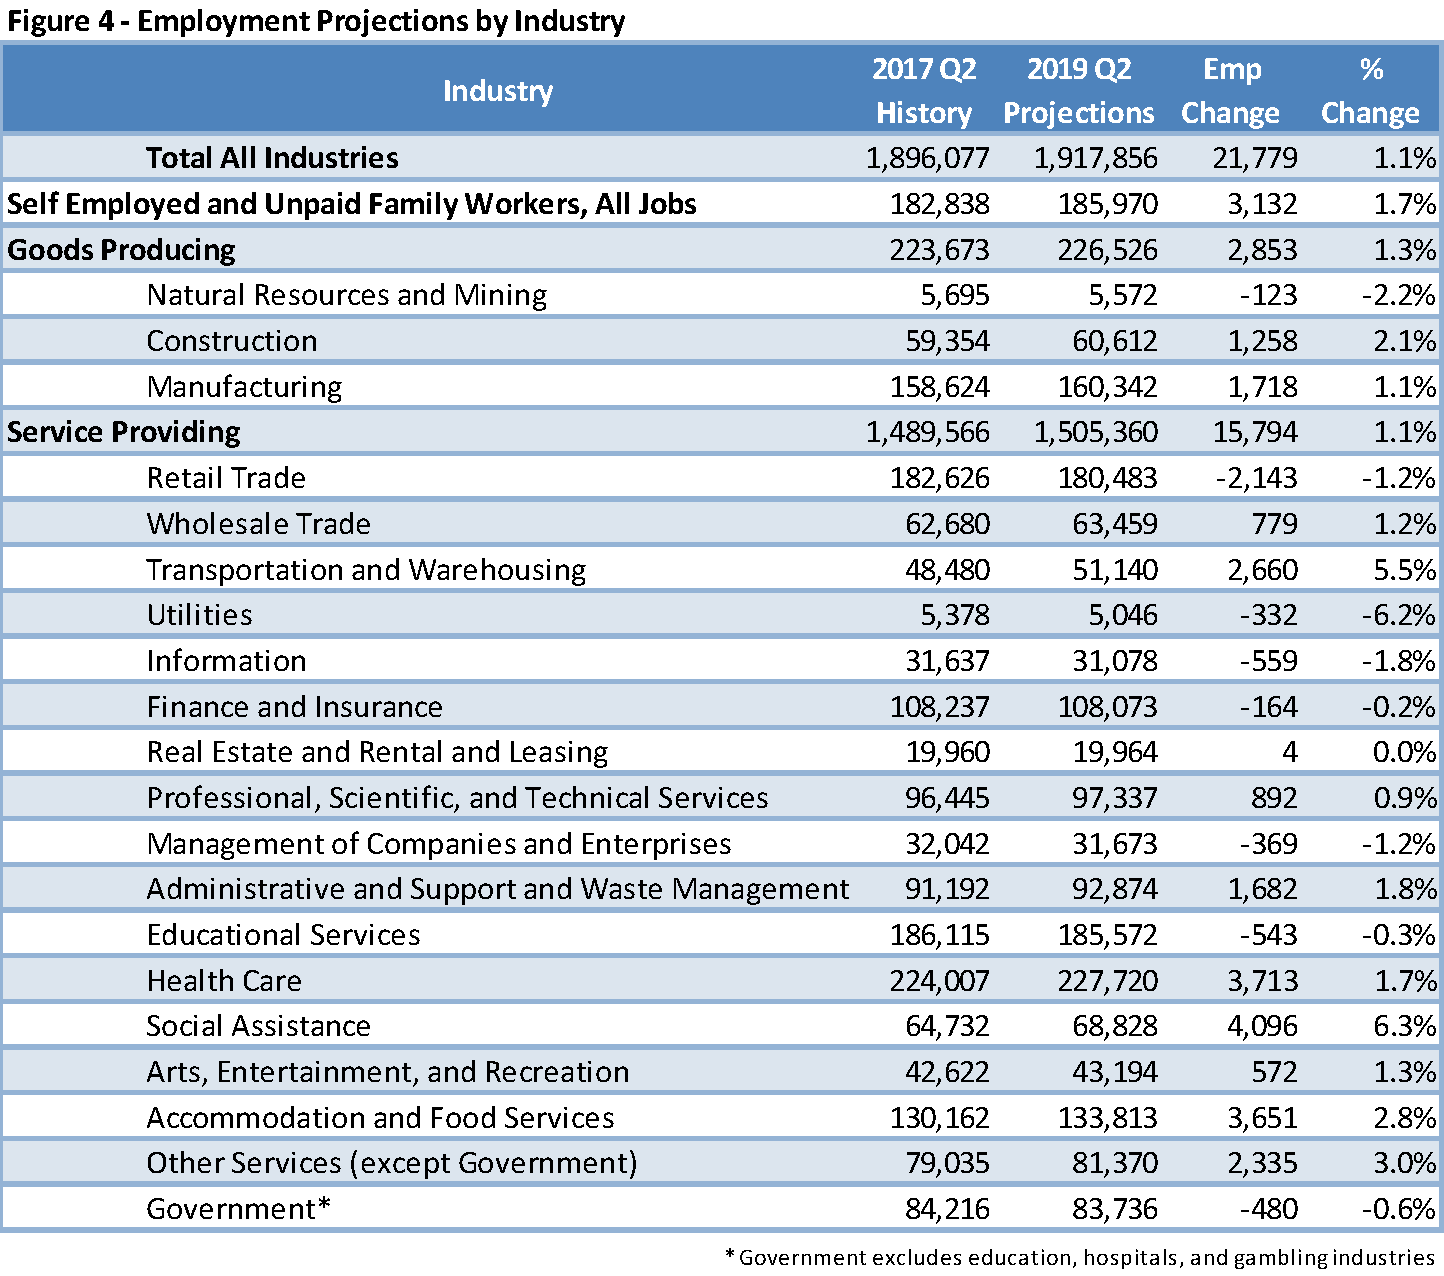
The current projections are for the period from the second quarter of 2017 to the second quarter of 2019. During this period we project overall employment in Connecticut to increase by 1.1% from 1,896,077 to 1,917,856, as is shown in Figure 4. This rate increase exceeds the rate from last year’s short term projection.
Projections by Industry
Major Industries that are projected to have the largest percent employment increases are the Other Services, Leisure and Hospitality, and Construction sectors, which we project to grow 3.0%, 2.4%, and 2.1%, respectively. The growth in Leisure and Hospitality continues longer term trends, and Construction growth represents a turnaround for that sector which had a small decline in the most recent year.
The major sectors that show significant decreases are Information, down 1.8%, Government 2, down 0.6%, and Financial Services, down 0.1% over the two-year period. The decreases in Information and Government sector employment continue longer term trends. The slight loss in Financial Services is driven by the Finance and Insurance component of that sector. Real Estate is expected to increase slightly, by 0.2% over the period.
Projections by Occupation
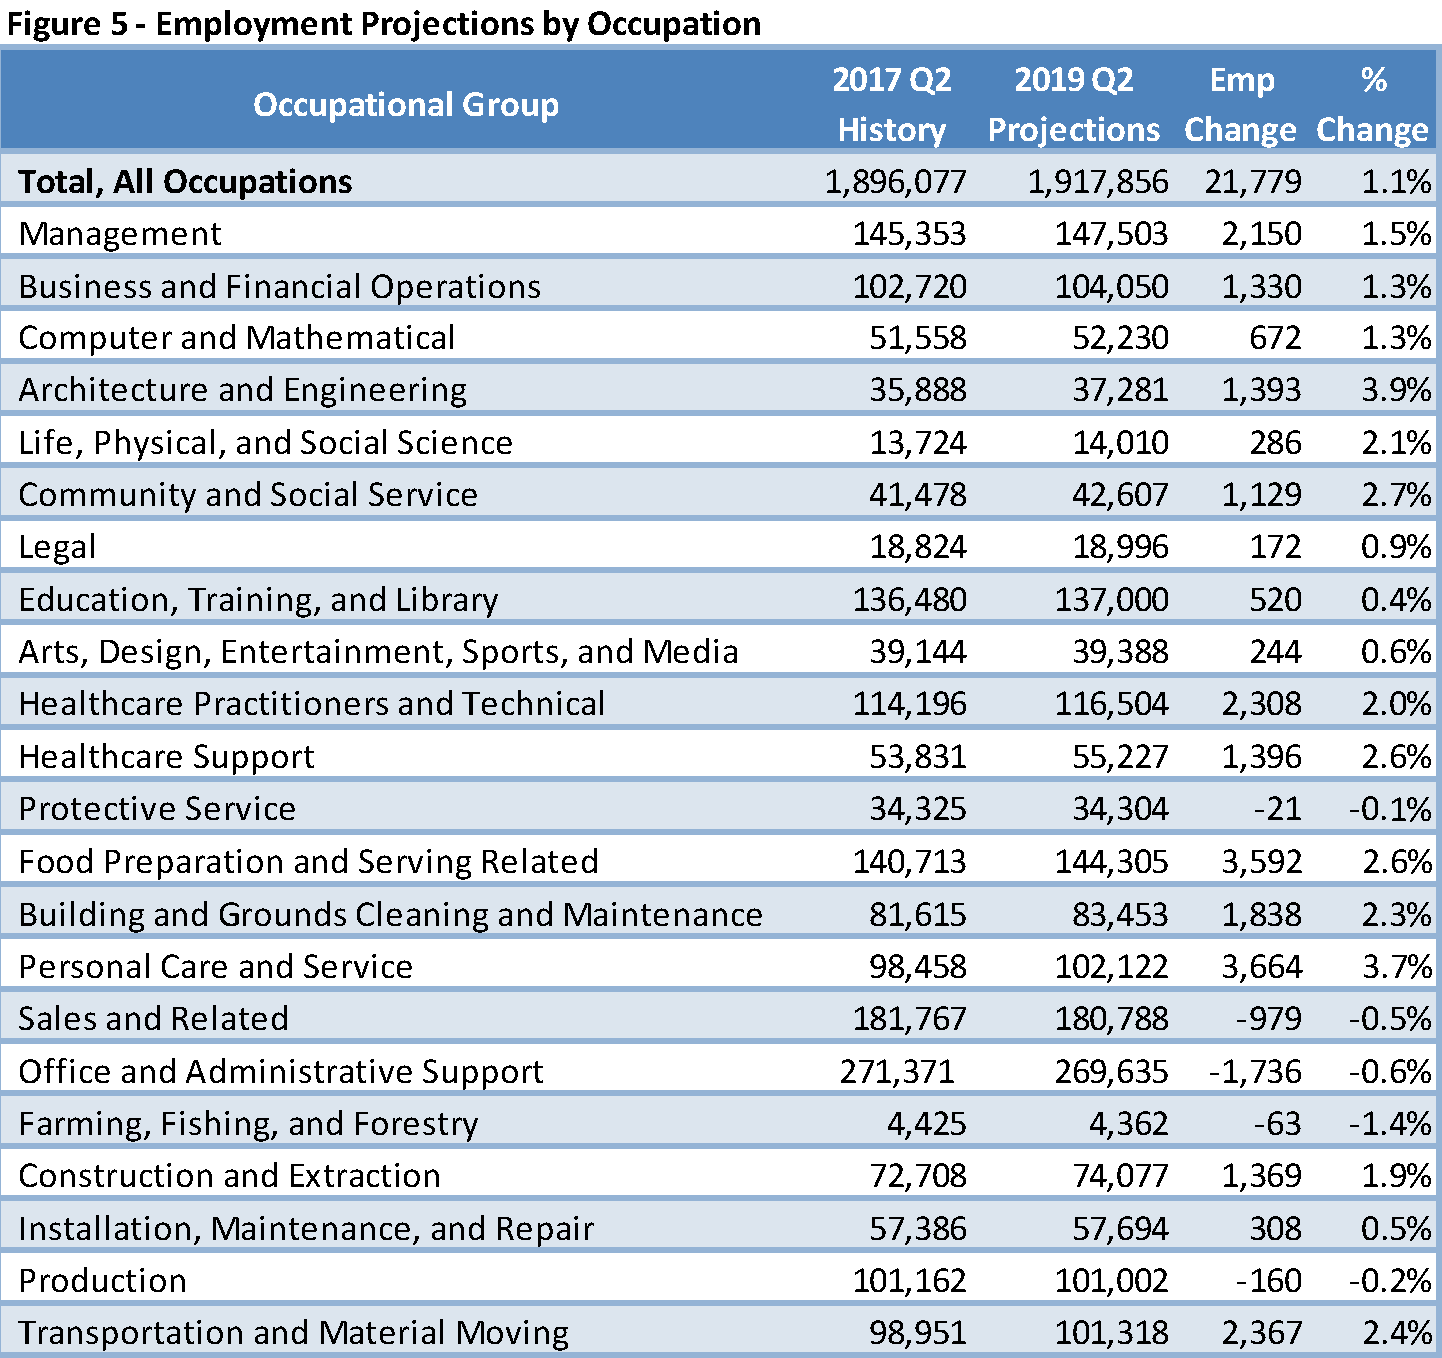
As is noted above, the 1.1 percent projected growth for the overall economy corresponds to an employment increase of 21,779 during the two-year period ending on 2019 Q2. The occupational groups expected to increase the most are Personal Care and Service Occupations, up 3,664 jobs, Food Preparation and Serving Related, up 3,592 jobs, Transportation and Materials Moving Occupations, up 2,367 jobs, and Healthcare Practitioners and Technical, up 2,308 jobs. The three major occupational groups projected to decline over the two-year period are Office and Administrative Support, down 1,736 jobs, Sales and Related, down 979, and Production Occupations, down 160 jobs. The changes in occupational employment shown in Figure 5 are driven by the industry changes discussed in the previous section. For example, the growth in Accommodation and Food Services drives the increase in Food Preparation and Serving occupations.
Connecticut’s Projections Compared to Other States
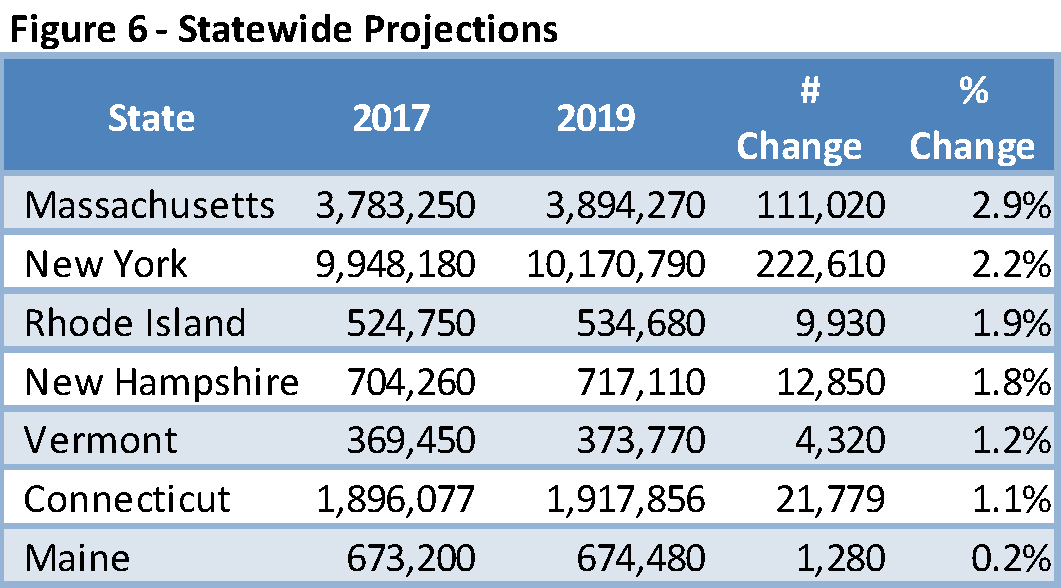
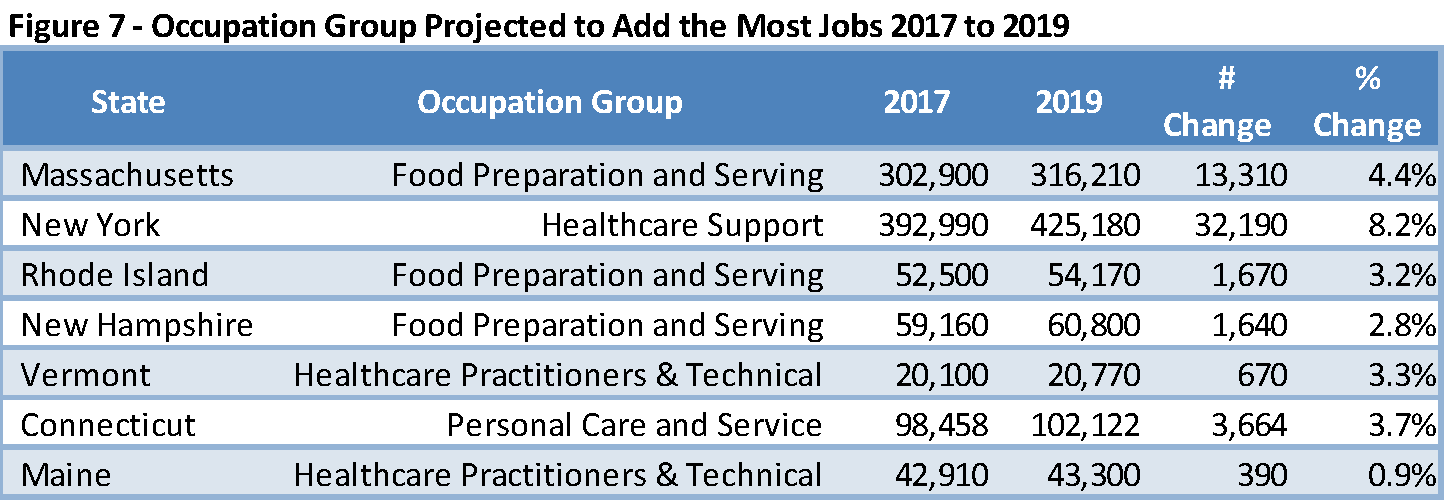
Connecticut’s projected 2017- 2019 job growth is slower than projected by most other states, although it is faster than the growth projected by seven states, including Delaware, Kansas and Maine. Twenty states are projecting growth under 2% — or less than 1% per year. As shown in Figure 6, among area states, Massachusetts is projecting the fastest growth (+2.9) while Maine is projecting the slowest – up just 0.2% over two years. As shown in Figure 7, Food Preparation and Serving is projected to add the most jobs in three of our neighbor states. Connecticut jobs are expected to grow in this category as well – 3,592 additional jobs or a 2.6% increase. Healthcare support occupations are projected to grow a whopping 8.2% in New York over the two-year period, behind just Arizona and nearly double Massachusetts’ 4.4% increase. Connecticut’s 2.6% increase in this category is comparable to that in other area states except Maine which is significantly lower. The category projected to add the most jobs in Connecticut is Personal Care and Service, led by Personal Care Aides, Childcare Workers, Hairdressers & Cosmetologists, and Nonfarm Animal Caretakers.
Conclusion
Connecticut’s short-term projections show that Connecticut’s slow employment growth over the recent few years is likely to continue, and sectors will continue to shift. Manufacturing is picking up while Education expected to slow. Connecticut is also part of a national trend which sees increases in warehousing and transportation while retail is under pressure.
There are both upside and downside risks to these projections. Connecticut is part of the national and global economies and has employment concentration in industries tied to the financial markets. Uncertainty and volatility in the economy and markets could hurt Connecticut. On the other hand, national job growth has been steady in early 2018 and Connecticut has participated in that increase. Our best judgment is that the rapid growth seen in early 2018 will moderate but that growth will continue through the end of the projections period.
Data Limitations: The projections in this report have been carefully prepared to ensure accuracy, but by nature are subject to error. For more detail on the short-term occupational projections, visit: www.projectionscentral.com/Projections/ShortTerm.
1 For more analysis of Connecticut’s manufacturing labor force, see pages 24-26 of: https://www1.ctdol.state.ct.us/lmi/pubs/ConditionsandOutlook2016to2018.pdf
2 Government excluding education, hospitals, and gaming.

