What is Ailing Connecticut's Economy? Is it a City Problem? Is it a Sector Problem?
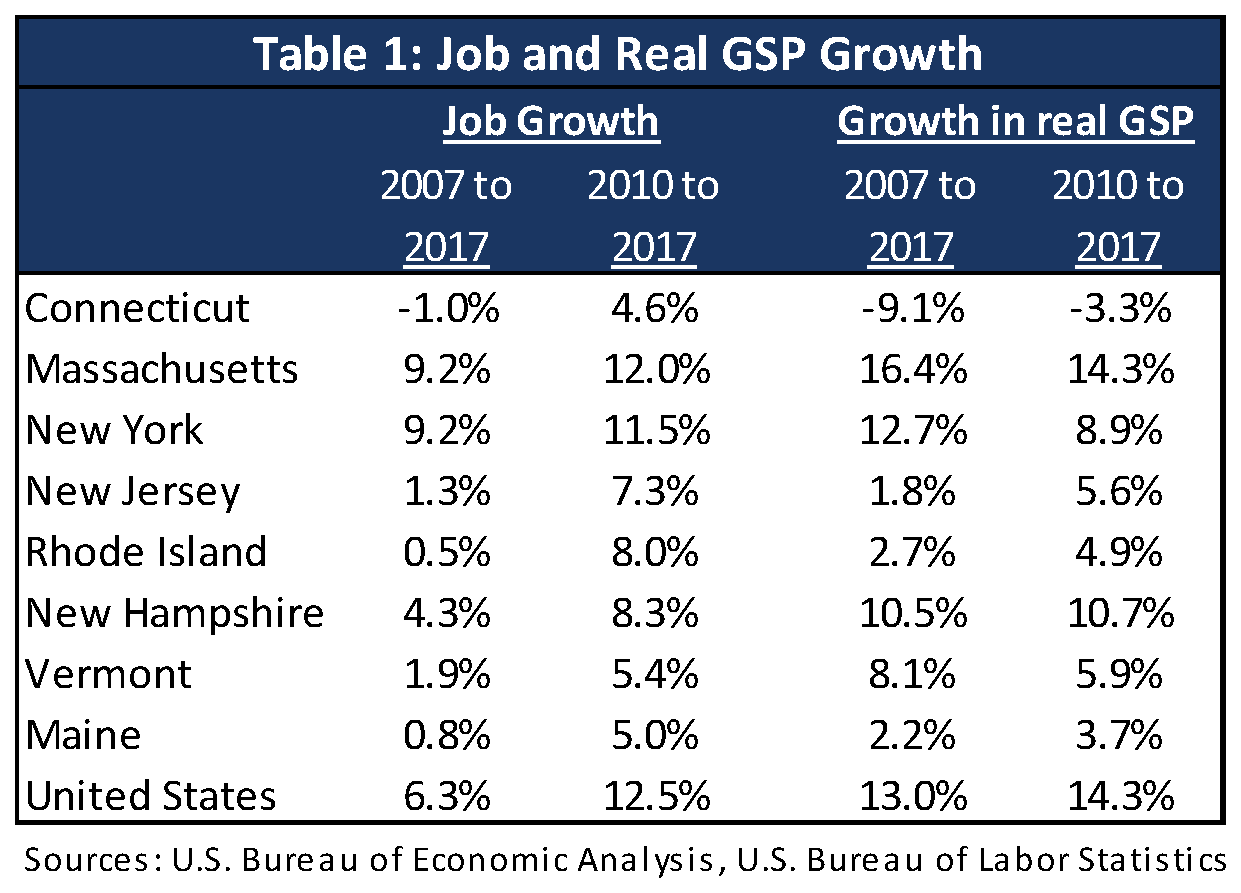
By Manisha Srivastava, CT OPM, Manisha.Srivastava@ct.govConnecticut’s economic recovery from the 2007-2010 recession has lagged not only the country but also the region. Table 1 compares Connecticut’s job growth and gross state product growth (GSP - a measure of goods and services produced within a region, utilized as a broad measure of economic activity) to regional states and the nation. The nation recovered jobs lost as a result of the recession by May 2014, and has since experienced job growth of 12.5%. Connecticut’s job growth since the recession at 4.6% is close to Maine (5.0%) and Vermont (5.4%), but is one of the few states yet to recover all jobs lost during the recession. On GSP, Connecticut is the only state to continue losing economic activity even since the end of the recession (-3.3%). In fact, in inflation-adjusted, or real GSP terms – Connecticut’s economy is at the same level it was in 2004. This lackluster economic growth has resulted in anemic revenue growth in the state, leading to years of budgetary constraints.
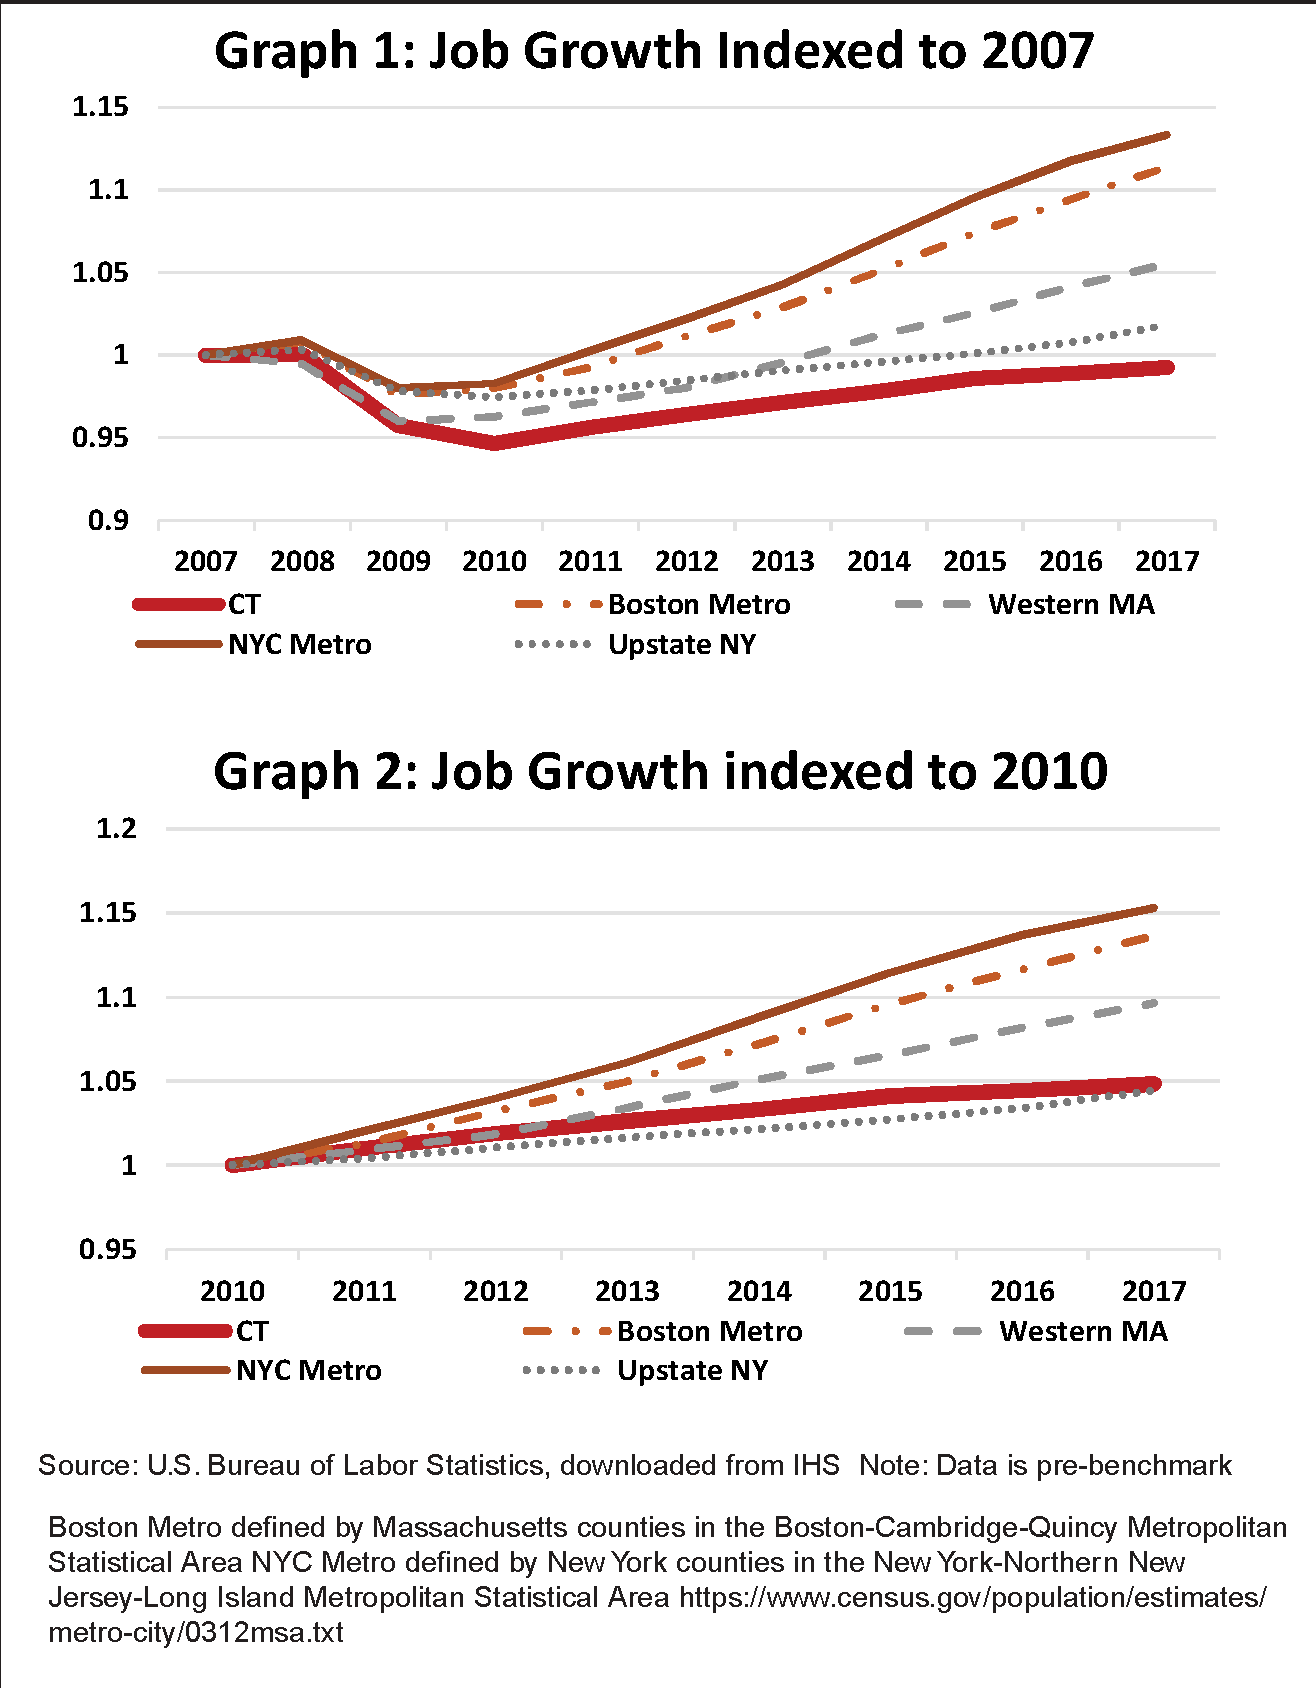
What is ailing Connecticut’s economy? One thought is Connecticut has a city problem – or specifically lack of a major city. Numerous studies have shown job growth has been concentrated in major urban areas since the last recession. To test how much the lack of major urban centers is a problem, Graph 1 divides up job growth for Massachusetts into the Boston Metro area versus western Massachusetts, and job growth for the New York City metro region versus for upstate New York. Assuming Connecticut is similar to western Massachusetts or upstate New York, how does job growth compare for these northeastern regions? Graph 1 shows job growth indexed to 2007 – Connecticut lags in job growth even compared to western Massachusetts and upstate New York. However, note that the job losses during the recession were less in western Massachusetts and especially in upstate New York than in Connecticut. Graph 2 focuses on job growth during the recovery period by indexing to 2010. Adjusting the time frame shows upstate New York and Connecticut have experienced essentially the same rate of job growth. Many of the issues that affect Connecticut also affect upstate New York – including slow population growth, decades-long loss of manufacturing jobs, and the exit of larger employers. Western Massachusetts, even though it does not have a major city, continues to outperform both Connecticut and upstate New York.
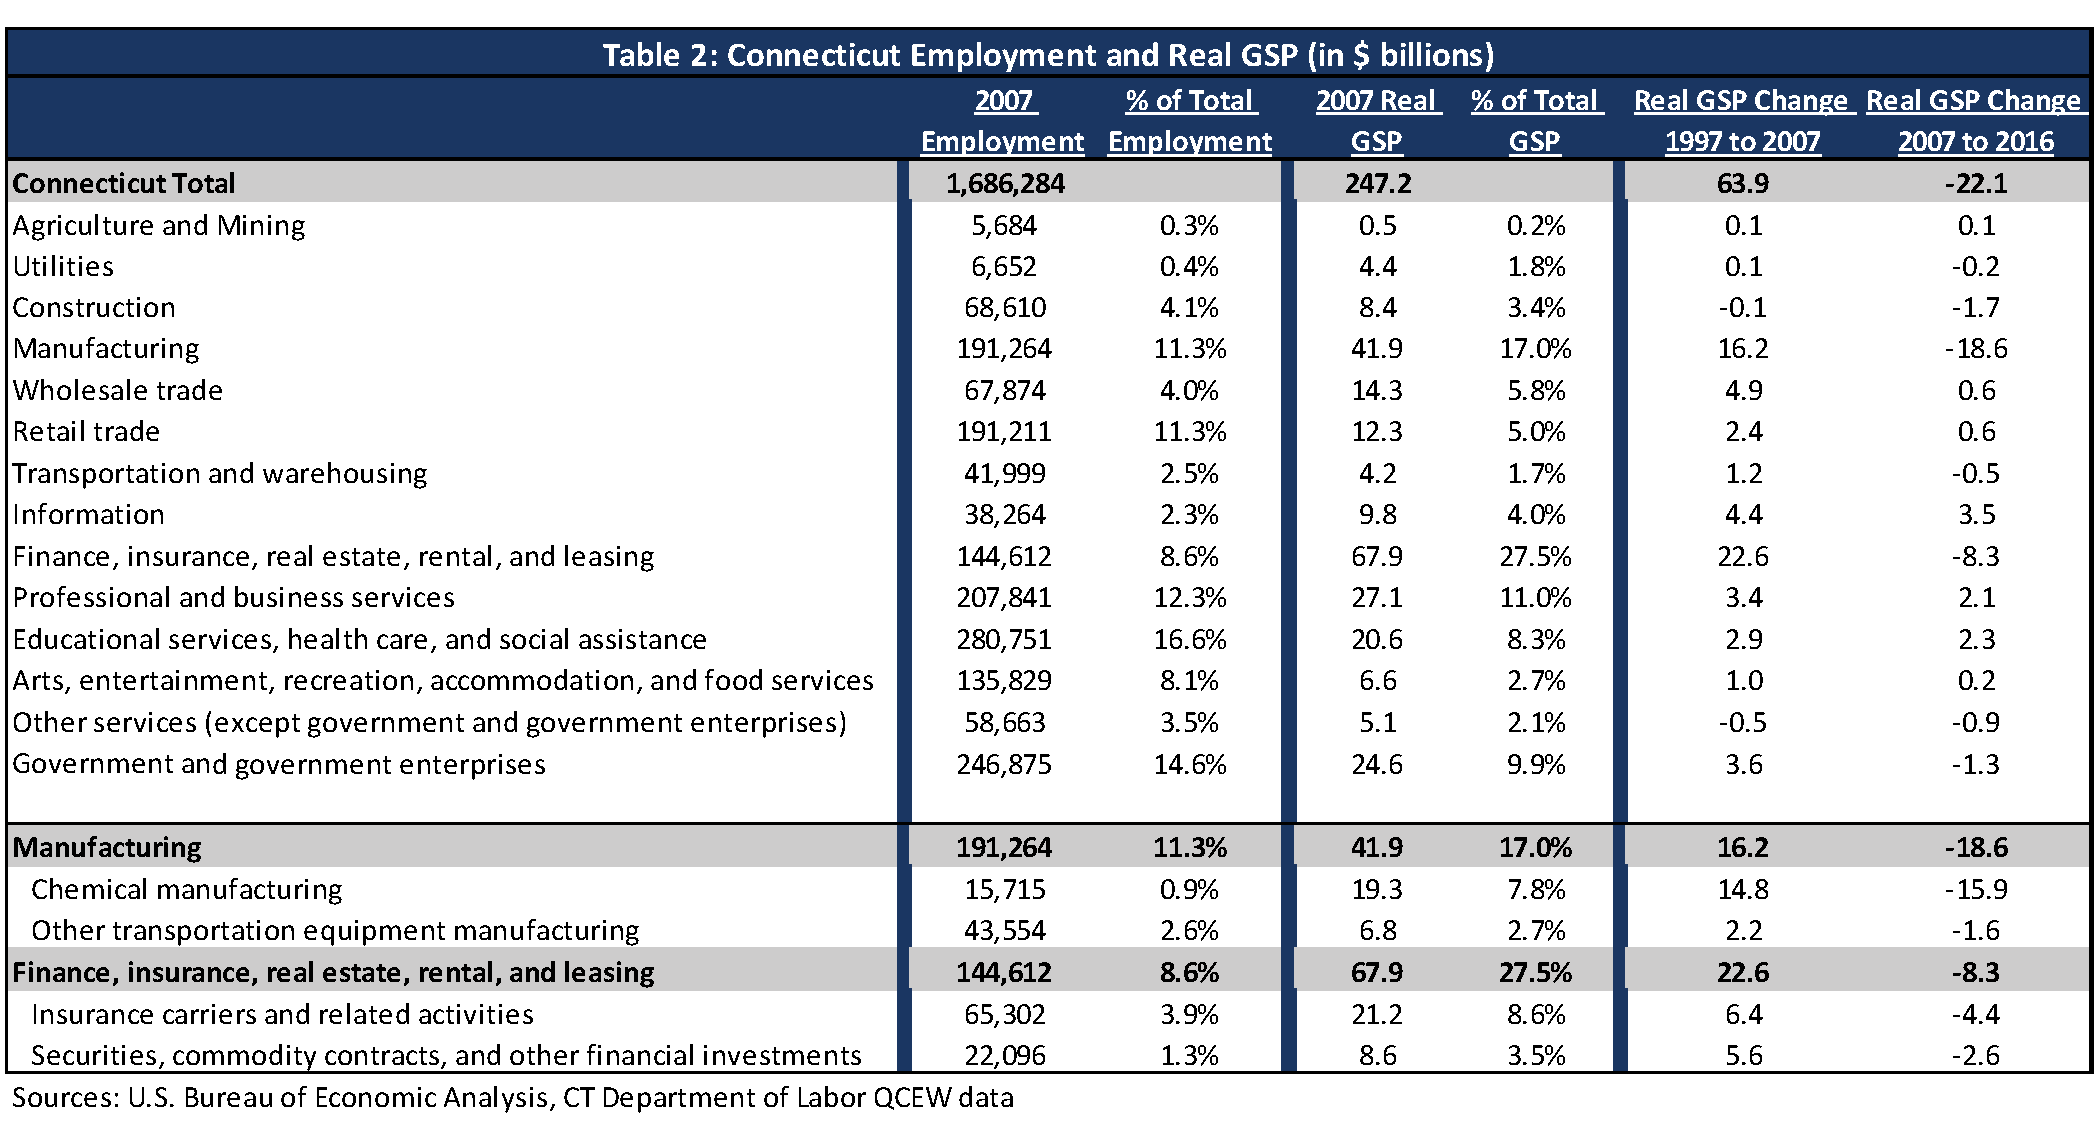
As displayed in Table 1, Connecticut’s economic recovery is also lagging in terms of inflation-adjusted, or real, gross state product. Massachusetts is up 14.3%, New York is up 8.9%, while Connecticut’s economy has been shrinking post-recession. Table 2 breaks down GSP growth by industry sector in the decade leading up to the Great Recession and the following decade to help understand what is causing Connecticut’s subpar economic performance. From 1997 to 2007 Connecticut’s GSP grew by close to $64 billion, but fell by $22 billion from 2007 to 2016. Digging into the data by industry sector shows that loss of manufacturing is the largest cause of GSP decline. Manufacturing contributed $16.2 billion of the increase in the decade prior to the recession, but has since subtracted $18.6 billion. The loss in manufacturing was driven by chemical manufacturing, which helped grow Connecticut’s economy by $14.8 billion prior to the recession but lost $15.9 billion over the last decade. This is evidenced by the downsizing or departure of firms such as Pfizer, Bayer, and Bristol Myers Squibb. The Financial Activities sector, which includes finance, insurance, and real estate, is the next largest driver of Connecticut’s lost economy. Overall Financial Activities went from contributing $22.6 billion of the increase in the decade prior to the recession to removing $8.3 billion from Connecticut’s economy. The largest declining subsectors were insurance (-$4.4 billion) and securities and financial investments (-$2.6 billion). It is important to note that essentially all sectors in Connecticut showed slower real growth, or a decline in the decade post-recession compared to pre-recession. However, the overall decline Connecticut is witnessing in its economic activity is driven by just a few subsectors.
It is interesting to note that in 2007 chemical manufacturing accounted for 7.8% of Connecticut’s total GSP, whereas transportation equipment manufacturing accounted for 2.7%. However, 2007 average employment in transportation equipment was over 43,000 (with an annual average wage of about $81,000), whereas employment in chemical manufacturing was less than half of that at 15,715 (annual average wage of about $118,000). Essentially, the value of goods produced by the chemical manufacturing industry resulted in its outsized contribution to total GSP in the state. This begs the question – what’s more important to an economy, growing industry sectors that employ more people at good wages, or growing sectors that are highly productive (i.e., generate greater GSP returns)?
Regardless, this analysis shows the value in diving below the headline data to truly understand the economic forces driving our economy. There are claims that Connecticut’s tax increases in 2009, 2011, and 2015 have cost our state in regional competitiveness and economic growth. While that topic is beyond the scope of this article, the evidence presented here shows that Connecticut’s job growth post-recession is similar to the level of upstate New York – despite the tax increases implemented in Connecticut. Both regions, however, lag neighboring Western Massachusetts. The GSP analysis by sector shows that if a few sectors had performed differently after the last recession, CT could have turned declines into real GSP growth. Understanding the layers that add to topline numbers is important for policy makers who are looking to improve CT’s future economic performance.


