2018 Housing Market in Review
By Kolie Sun Kolie.Sun@ct.gov, Senior Research Analyst, Department of Economic and Community Development
 onnecticut’s housing market experienced growth in 2018 with many economic indicators posting gains over the prior year. In this annual review, we will examine the state’s housing industry from the permits, sales and price perspectives.
Employment
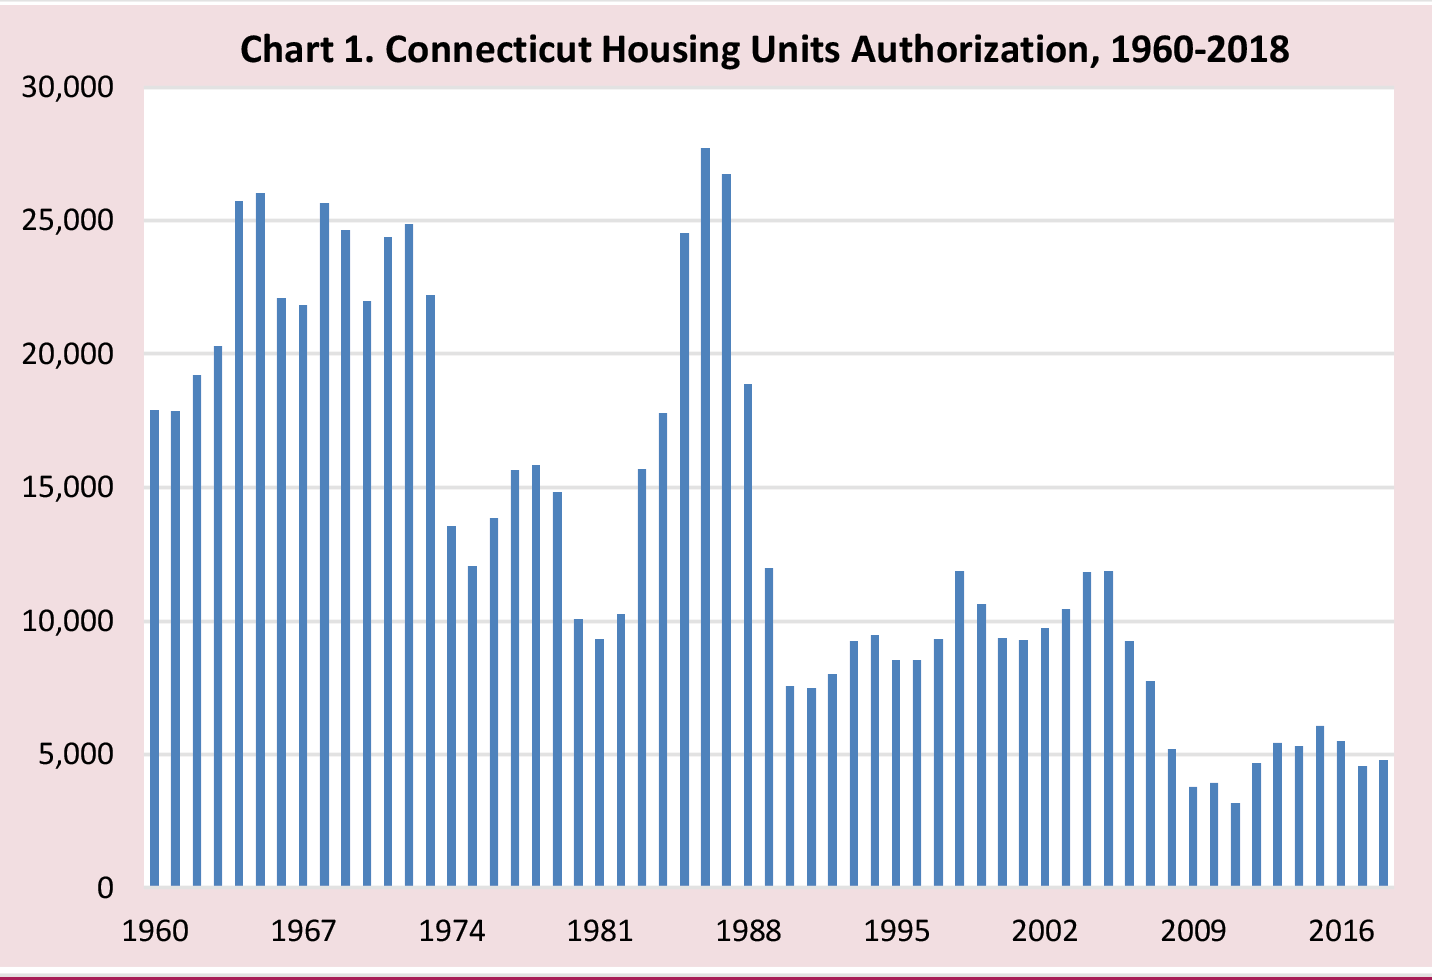
According to data released by the Bureau of the Census, cities and towns in Connecticut authorized a total of 4,815 single and multifamily homes with a total valuation of $1.112 billion in 2018. This level of production represents a 5.9% increase compared to 4,547 in 2017, and a 12.5% decrease compared to 5,504 in 2016 (See chart 1).
New Haven County regained the lead in the number of permit authorizations since 2010, with the largest share (24.2%) in 2018, followed by Hartford County (23.6%) and Fairfield County (22.8%). Litchfield County had the smallest share (2.6%).
Several municipalities showed strong performance in the number of permits authorized. New Haven led all municipalities with 460 units, followed by Simsbury with 199, Westport with 194, Stonington with 183, and Milford with 167. The combined permits issued for the top five municipalities accounted for a quarter of all housing units the state authorized in 2018.
New housing can be broken down into single family and multifamily homes that ranges from two-unit duplexes to large apartment buildings with hundreds of units. Although the majority of households live in single family homes, multifamily units have become increasingly important to the housing market. In 1998, Connecticut’s multifamily units accounted for 23.0% of housing permits authorized, but that share has doubled to 47.0% in 2018. This increase is partially attributed to the growth of transit-oriented development, creating walkable urban environments that are seen as increasingly attractive — especially to millennials.
The Department of Economic and Community Development (DECD) annually surveys each municipality for demolition information. One hundred thirty-four Connecticut towns responded (79.3% response rate), reporting 1,225 demolished units last year. As a result, the state’s net gain of 3,590 units brings its housing inventory estimates to 1,517,655 units.
Economic Indicators
Employment, gross domestic product (GDP), and personal income are some of the economic indicators that can impact growth in the housing sector.
Connecticut’s economy experienced a modest growth last year. According to the Bureau of Economic Analysis (BEA), Connecticut’s real GDP, the most commonly used barometer to measure a state’s economic health, increased 1.0% in 2018 after small declines in the previous two years. The U.S. economy expanded 2.9% during the same year. Washington experienced the highest growth rate of 5.7% and Alaska was the only state with negative growth. Connecticut’s economy was valued at $274.2 billion in 2018.
Connecticut saw an employment increase in 2018. Based on annual average data, not seasonally adjusted, from the Department of Labor (DOL), the state gained 1,600 (0.1%) jobs in 2018, compared to 3,500 (0.2%) jobs in 2017; while U.S. employment grew at 1.6% in 2017 and 1.7% in 2018. According to DOL, the state’s private sector has recovered more than 100% of the jobs lost in the great recession (March 2008 through January 2010).
With the improved job market, Connecticut’s unemployment rate continued to fall. According to the Bureau of Labor Statistics, state’s annual average unemployment rate was estimated at 4.1% in 2018. This was the lowest level since 2001. From the same source, U.S. unemployment rate was estimated at 3.9%. Within the continental U.S., Iowa had the lowest unemployment rate of 2.5% and West Virginia the highest at 5.3%.
Personal income is a component of consumer spending. Higher income translates to higher disposable income that implies stronger growth in consumer spending that can lead to a stronger economy. Connecticut’s personal income increased 3.4% in 2018, after increasing 3.3% in 2017, according to estimates release from BEA. At the national level, personal income grew 4.5% in 2018, and 4.4% in 2017. However, Connecticut’s per capita income remains the highest in the nation at $74,561.
Home Sales and Prices
With an improved economy, strong consumer confidence and a lower unemployment rate in 2018, Connecticut’s real estate market had a strong showing as home prices rose and house sales were at their second highest level in ten years.
According to the Warren Group report, Connecticut’s median single-family sale price reached $268,000, a 3.2% increase from a year earlier. Although it achieved an 11-year high last year, it still is almost 10% below the peak value of $295,000 in 2007.
From the same source, Connecticut’s single-family home sales totaled 33,594 in 2018, a 1.9% decrease from the previous year. Condominium sales did better with a gain of 0.1% over 2017.
Real estate markets vary from region to region. Fairfield County saw modest decreases in unit sales and dollar volumes, while the Connecticut shoreline saw minimal decreases in unit sales even as dollar volume improved. Litchfield County experienced sales growth and the Farmington Valley was flat with steady sales. For example, Fairfield County unit sales and dollar volume decreased 2% and 4%, respectively, last year, while median selling price increased 1% to $455,000. It is still 20.9% below the pre-recession median selling value of $575,000 in 2007.
According to the Federal Housing Finance Agency’s House Price Index (HPI), U.S. house prices advanced 5.7% from the fourth quarter of 2017 to the fourth quarter of 2018. The HPI ranges from the highest annual appreciation in Idaho (11.9%) to smallest in North Dakota (0.0%). Connecticut’s HPI increased at the 0.9%. For the five-year period (Q4:2013 to Q4:2018), Connecticut’s HPI rose 7.4%, compared to 32.8% at the U.S. level, indicating very little home price appreciation in our state.
Raising rates affects millions of Americans, including home buyers, savers and investors. The Fed raised interest rates four times in 2018. As a result, mortgage rates increased to the highest level since 2010. According to Freddie Mac, the conventional 30-year mortgage rate on an annual average basis was 4.54% last year, up from 3.99% in 2017, 3.65% in 2016 and 3.85% in 2015. Despite the incremental increases, mortgage rates in 2018 remained at historic lows.
Housing Affordability
According to Diane Yentel, president and CEO of the National Low Income Housing Coalition: “Our country is in the grips of a severe and pervasive housing affordability crisis. Nationally, there is a shortage of 7 million homes affordable and available to the lowest-income renters. Rents have risen faster than renters’ incomes over the last two decades, and while more people are renting than ever, the supply of housing has lagged. Fewer than four affordable and available rental homes exist for every 10 deeply poor renter households nationwide. As a result, record-breaking numbers of families cannot afford decent homes.” 
As a state with a reputation for the highest per capita income in the nation, and some of the greatest income disparity among its cities and towns, housing affordability remained an issue for Connecticut in 2018. Moreover, the ability of employers to find workers and for employees to accept jobs can be negatively impacted when affordability presents a challenge.
In its 2018 report, the National Low Income Housing Coalition (NLIHC) cited that for Connecticut, the Fair Market Rent (FMR) for a two-bedroom apartment is $1,295. In order to afford this level of rent and utilities - without paying more than 30% of income on housing – a household must earn $4,317 monthly or $51,799 annually. Assuming a 40-hour work week (52 weeks per year), this level of income translates into an hourly housing wage of $24.90 per hour, the 9th highest in the nation.
The NLIHC in 2018 also found that a minimum wage worker earning an hourly wage of $10.10 in Connecticut must work 99 hours per week, 52 weeks per year in order to afford the FMR for a 2-bedroom apartment. Or a household must include 2.5 minimum wage earners working 40 hours per week year-round to make the two-bedroom FMR affordable.
Conclusion
In 2018, Connecticut’s housing market continued on its path to recovery with permit growth and home price appreciation. Early data suggests that the growth is likely to continue this year. The state’s new residential construction permits year-to-date (through June) increased 9.2% and the year-to-date median home prices reported at $256,000 is a 0.4% increase when compared to the same period a year ago.
State home sales, following the national trend, slowed down slightly in 2018. The National Association Realtors chief economist, Lawrence Yun, said it best: “…2017 was the best year for home sales in ten years, and 2018 is only down 1.5% year to date. Statistically, it is a mild twinge in the data and a very mild adjustment compared to the long-term growth we have been experiencing over the past few years.”
 In current dollars, Bureau of Economic Analysis.
 State Department of Labor, Labor Situation, August 15, 2019.
 Connecticut Median Single-Family Home Price Reaches 11-Year High in 2018, Still 10 Percent Below Peak, Mike Breed, January 23, 2019, Press Releases.
 2018 Year in Review Market Watch, William Pitt-Julia B. Fee Sotheby’s International Realty, January 15, 2019.
 The Affordable Home Crisis Continues, But Bold New Plans May Help – CityLab, March 14, 2019, Diane Yentel, president and CEO, National Low Income Housing Coalition.
 Bureau of the Census, Residential Construction Branch.
 The Warren Group, CT Single-Family Home Sales, Median Price Down in June, Mike Breed, July 31, 2019, Press Releases.
 |


