State Economic Indexes Improve Further in 2018
By Jungmin Charles Joo, Department of Labor and Dana Placzek, Research, Department of Labor

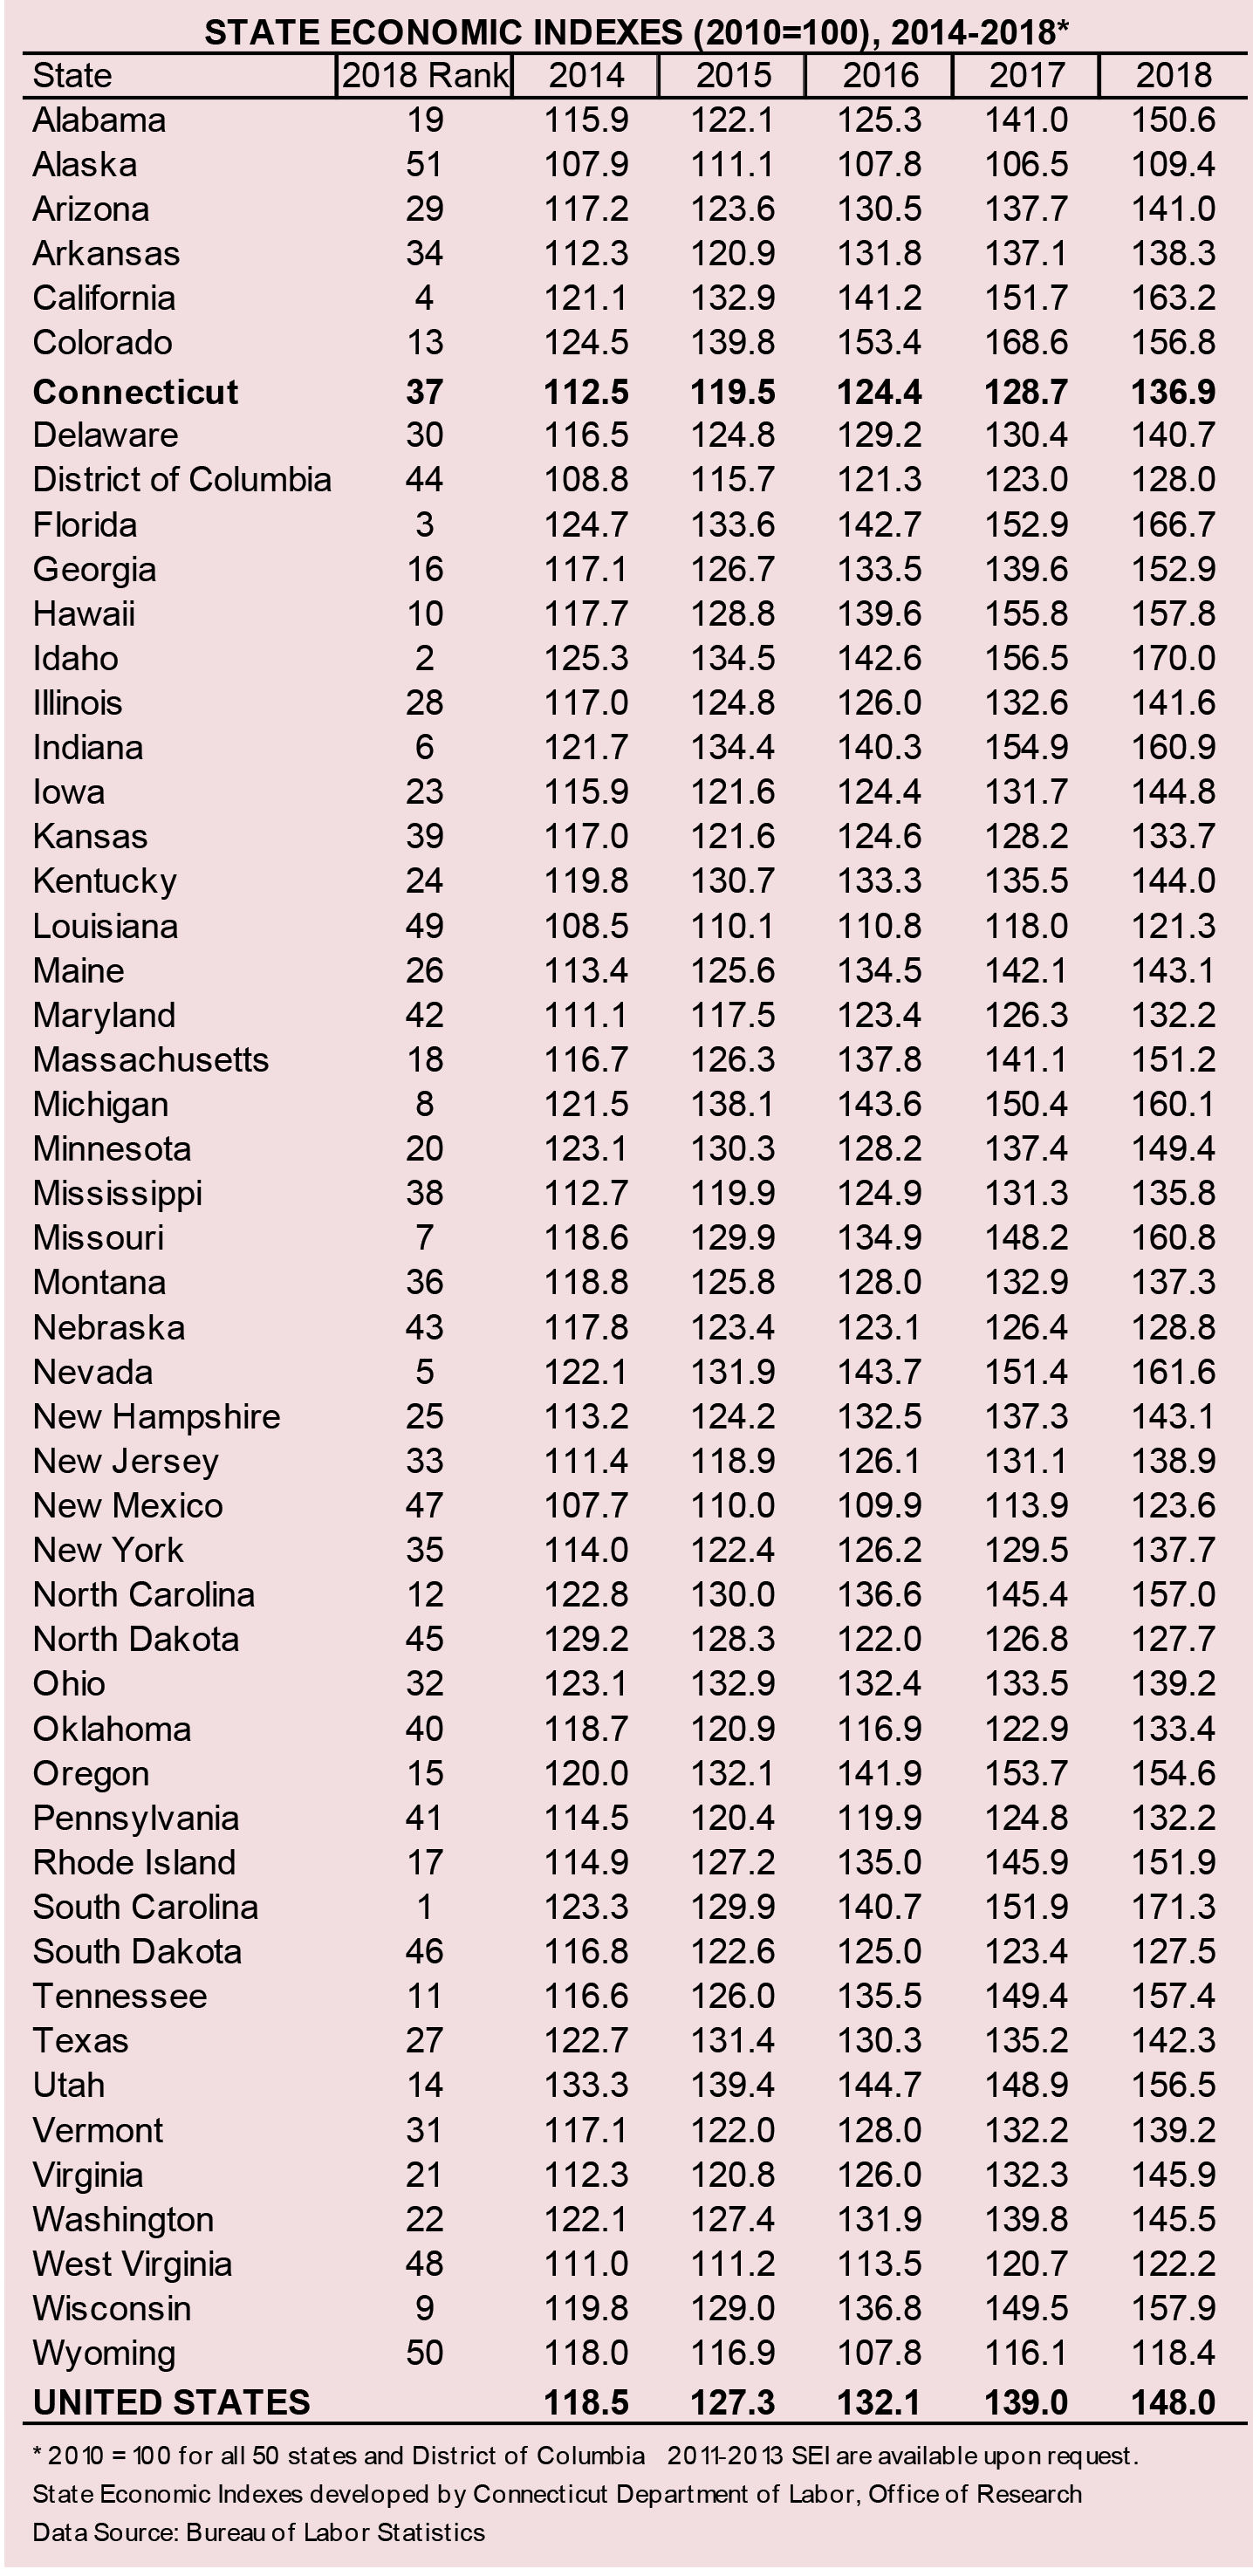
onnecticut's economic performance last year was the best in terms of ranking in eight years. After annual revisions, Connecticut ranked 37th out of the 50 states and the District of Columbia (DC) in the State Economic Indexes (SEI) in 2018, up from the 38th position in 2017.
For the first time, South Carolina came in first in the nation with the highest index of 171.3 last year, while Alaska continued to place last (109.4). Colorado, which had ranked number one for three years in a row, fell to 13th place in 2018. Our state’s index of 136.9 was below the nationwide value of 148.0 (see table).
SEI: Methodology
Applying the same components and methodology of the Connecticut Town Economic Indexes (See October 2019 issue), the Connecticut Department of Labor’s Office of Research also developed the State Economic Indexes for all 50 states and DC. With recently available annual average data from the Quarterly Census Employment and Wages (QCEW) program, along with the revised annual average unemployment rate from Local Area Unemployment Statistics (LAUS), annual SEI is reestimated for the 2010-2018 period.
These indexes provide a measure of the overall economic strength of each state that can be compared and ranked. Four annual average state economic indicators were used as components:
1. the number of the total covered business establishments
2. total covered employment
3. real covered wages
4. the unemployment rate
Business establishments are the physical work units located in the state. Employment is the number of employees on payrolls in the establishments that are located in the state who are covered under the unemployment insurance law (nearly the universe count of all the payroll employees in the state). Average annual pay is the aggregate wages earned divided by the total average employment. Establishments, employment and wages are proxies for each state’s business activities and its overall economic strength, while the unemployment rate measures the overall economic health of each state’s working residents.
Each of the four components of the SEI is given a 25 percent weight. SEI’s base year is 2010, which equals 100. The wage component is adjusted to 2010 dollars, and the unemployment rate change is inversed to reflect the right economic direction. By combining these four major economic indicators, the index gives a broad measure of business and resident economic conditions of each state that can then be compared and analyzed.
SEI: 2017 to 2018
Reflecting further growth in the current economic recovery in the nation, business and labor conditions of 50 of the 50 states and DC improved from 2017 to 2018, compared to 49 with increased SEI from 2016 to 2017. The fastest increase in the index occurred in South Carolina, Virginia, and Iowa. Connecticut ranked 20th among states, in terms of over-the-year growth rate (6.3%), moving up from 38th place in 2017. Meanwhile, the U.S. index rose 6.5% from 2017 to 2018. Colorado was the only state that experienced a decline last year.
SEI: 2010 to 2018
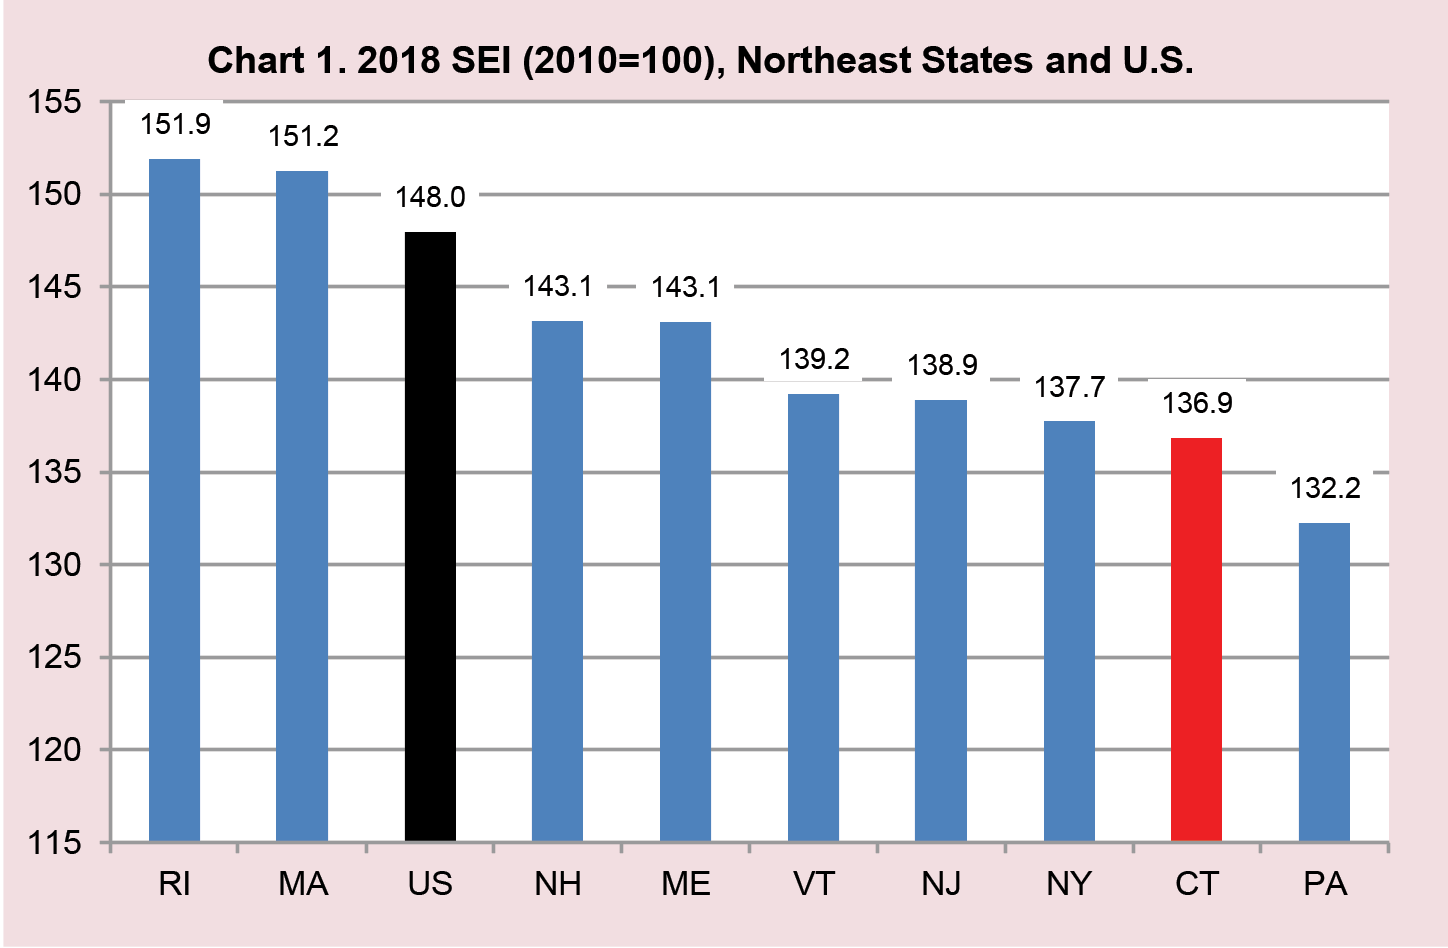
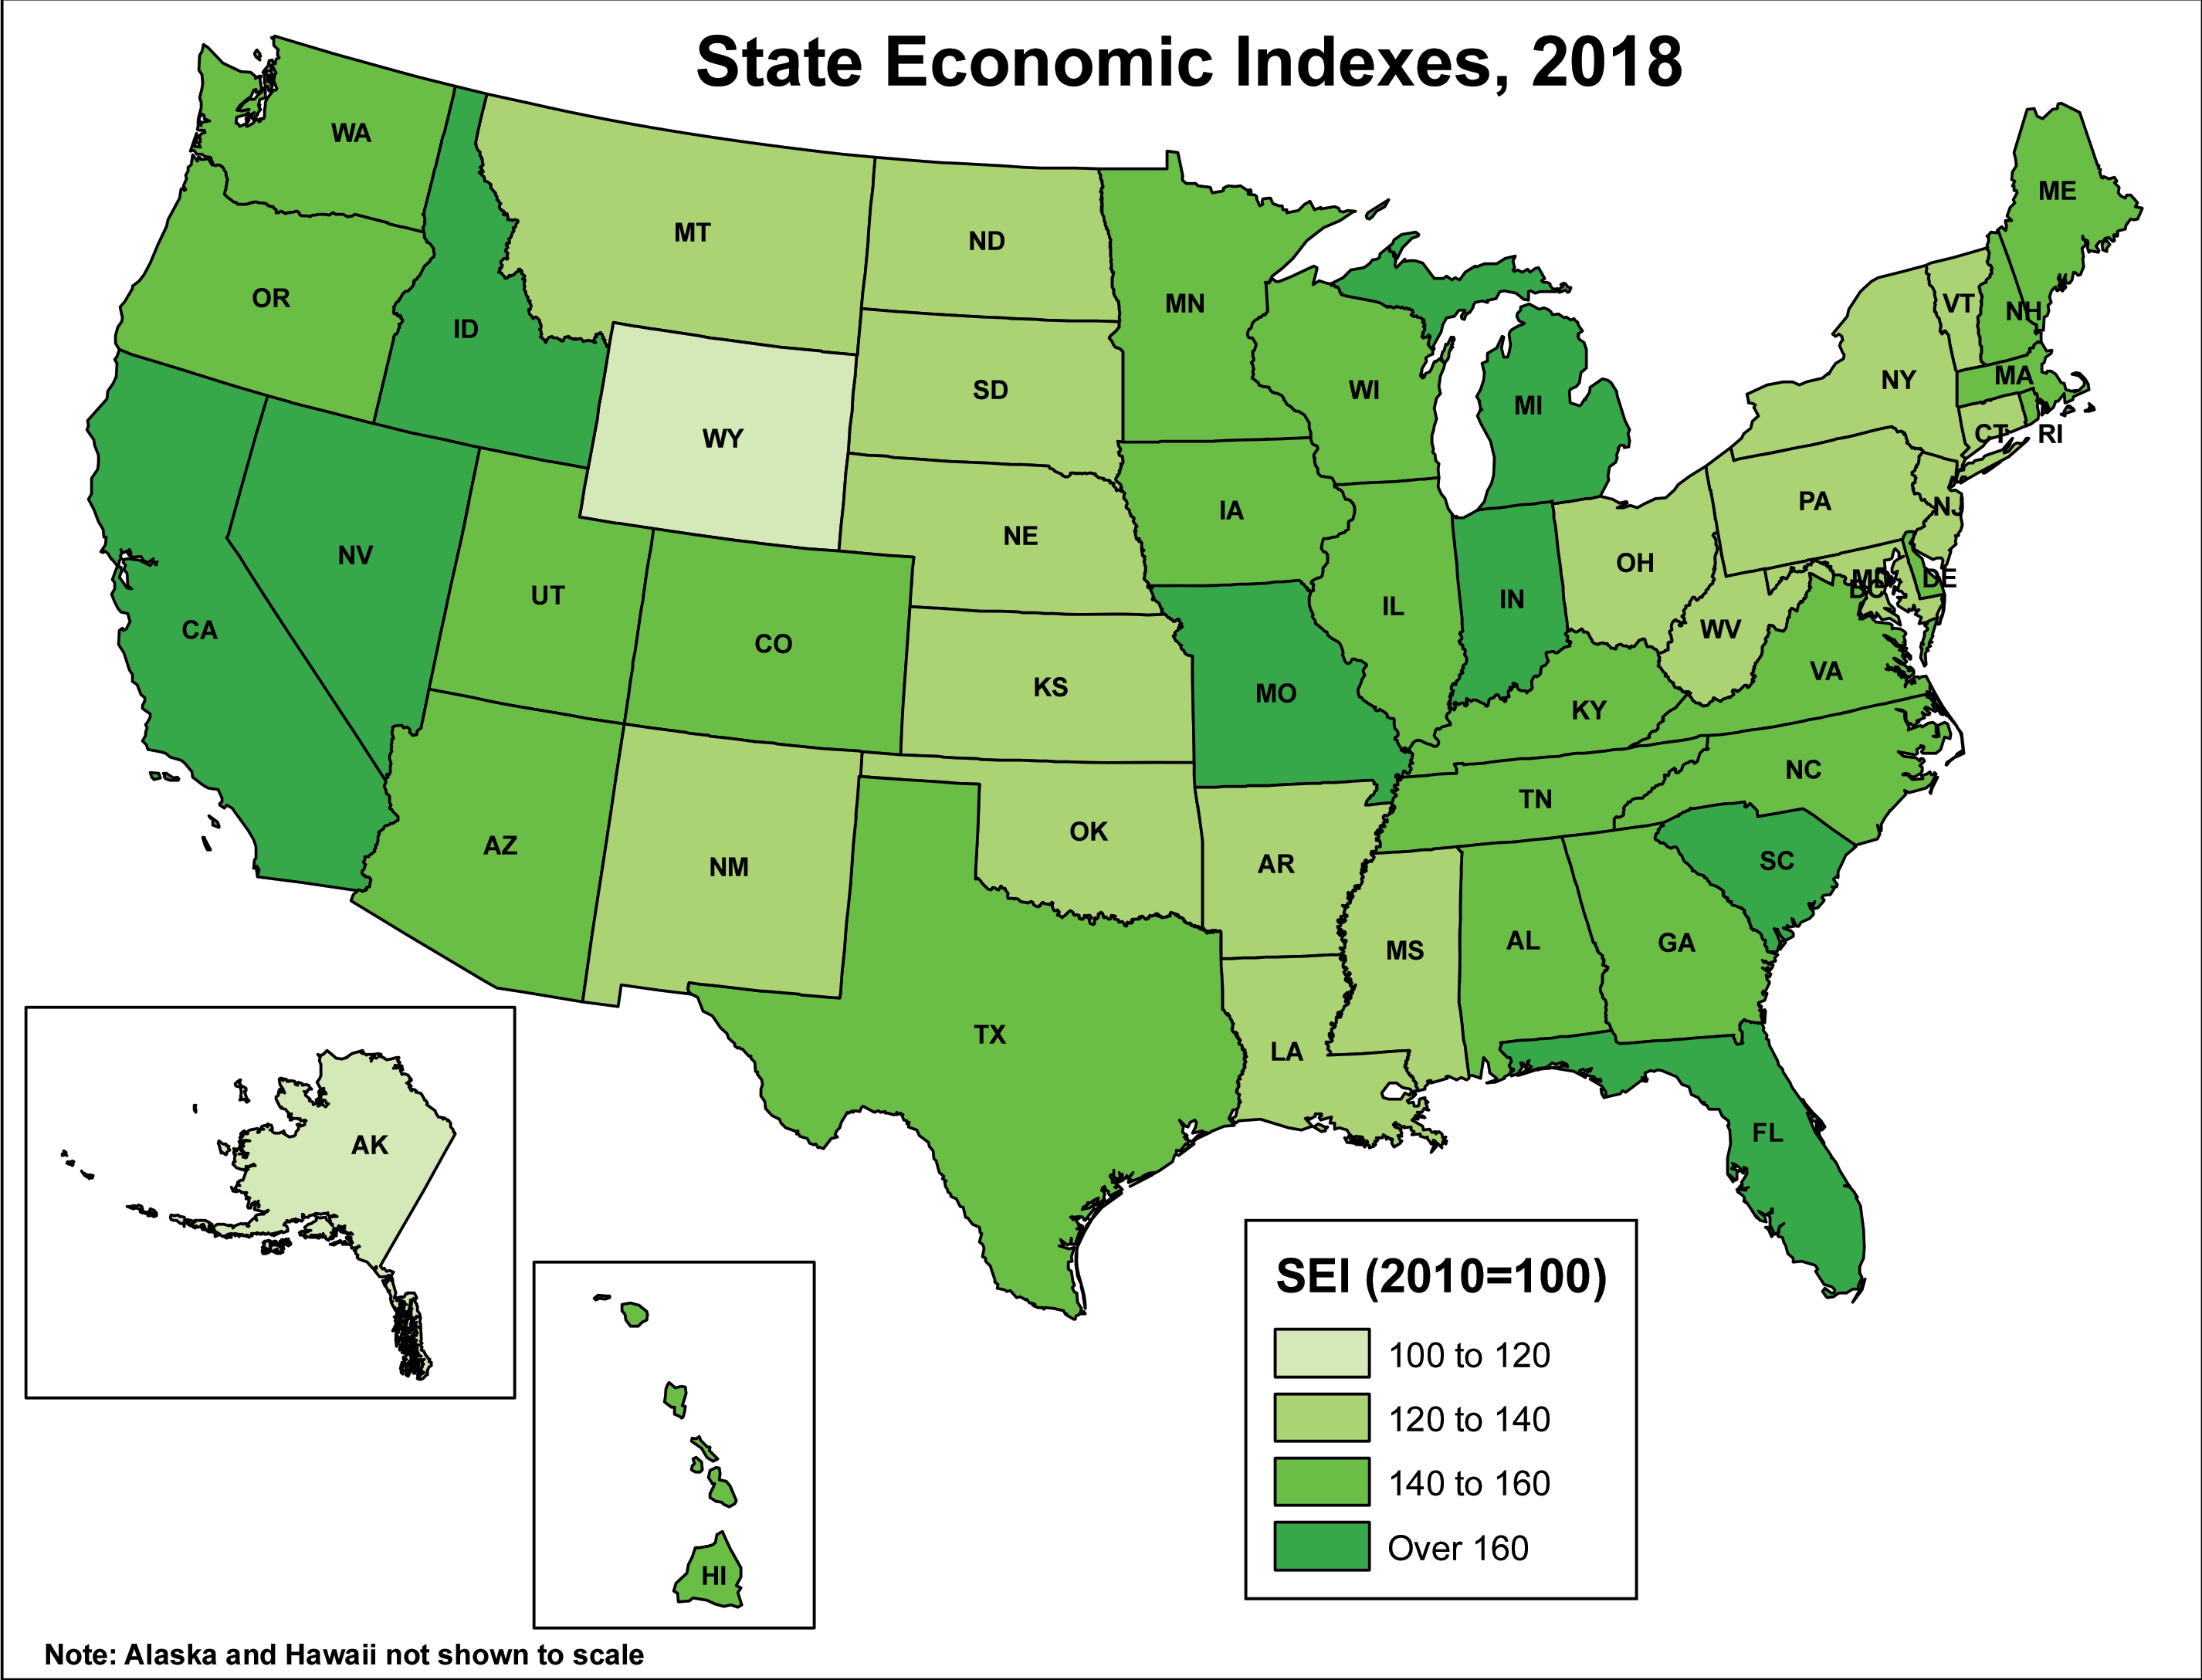
Looking longer term, all 50 states and DC continued to show positive SEI growth. South Carolina, Idaho, and Florida topped the list, when new business formations, jobs, real wages, and unemployment rates are all factored in. The Connecticut index increased 36.9% since 2010, when the economy began to recover, while the nation’s index grew 48.0%. Among the nine Northeast states, Connecticut again ranked 8th, just above Pennsylvania (Chart 1). Rhode Island’s economy improved the most since 2010. All in all, only 20 out of the 50 states and DC turned around faster than the national average from 2010 to 2018. The (map) shows the different ranges of economic recovery rate of each state.
Components of SEI:
Establishments
In terms of the number of establishments, Utah, Minnesota, and Idaho experienced the fastest growth over the year. Missouri, Maine, and Nebraska were among the five states with declines from 2017. Connecticut’s establishment growth rate ranked 19th among the states.
Over the last eight years, Utah, North Dakota, and Oregon had the fastest business formations. On the other hand, the number of establishments actually fell in Illinois and Michigan since 2010.
Employment
Last year’s average nationwide employment grew 1.6%, faster than 1.4% in 2017. Nevada, Idaho, and Utah were the top job growth states, while Connecticut ranked 49th in 2018. Alaska was the only state to lose jobs over the year.
During the 2010-2018 period, all states and DC added jobs. Utah, Nevada, and Colorado experienced the fastest employment gains during the current recovery. Meanwhile, Connecticut’s job growth placed 47th from 2010 to 2018.
Real Wages
All states posted inflation-adjusted wage gains in 2018. Washington, West Virginia, and Utah had the fastest annual pay increase. Connecticut ranked second to last in terms of wage growth, while South Carolina’s real income grew the slowest over the year.
Once again, the highest annual average pay was earned in DC at $93,566 in 2018 (in 2010 dollars). Connecticut’s wage fell from fourth to fifth highest ($66,087), following New York ($71,119), Massachusetts ($70,832) and California ($66,805). Only 12 states and DC posted wages higher than the nation’s average of $55,867 last year. The three states with the lowest average pay in 2018 were Mississippi, Idaho and Montana.
Since 2010, all 50 states and DC experienced income gains, with North Dakota, Washington, and California having the fastest increase. Connecticut’s wage growth came in last place among the states in the last eight years.
Unemployment Rate
Hawaii (2.4%), Iowa (2.5%), and New Hampshire (2.5%) posted the lowest unemployment rates in 2018. Conversely, Alaska (6.6%), DC (5.6%), and West Virginia (5.3%) had the highest unemployment rates last year. Connecticut’s 4.1% jobless rate was above the national rate of 3.9%. The biggest drops occurred in New Mexico, South Carolina, and Oklahoma. Colorado, Oregon, and West Virginia actually experienced an increase over the year.
Over the longer period, Nevada had the biggest unemployment rate drop, falling from 13.5% in 2010 to 4.6% in 2018. Michigan and California also experienced huge decreases over the last eight years. Connecticut’s jobless rate dropped from 9.1% to 4.1%, while it was from 9.6% to 3.9% nationally.
SEI Diffusion Index: 2010-2018
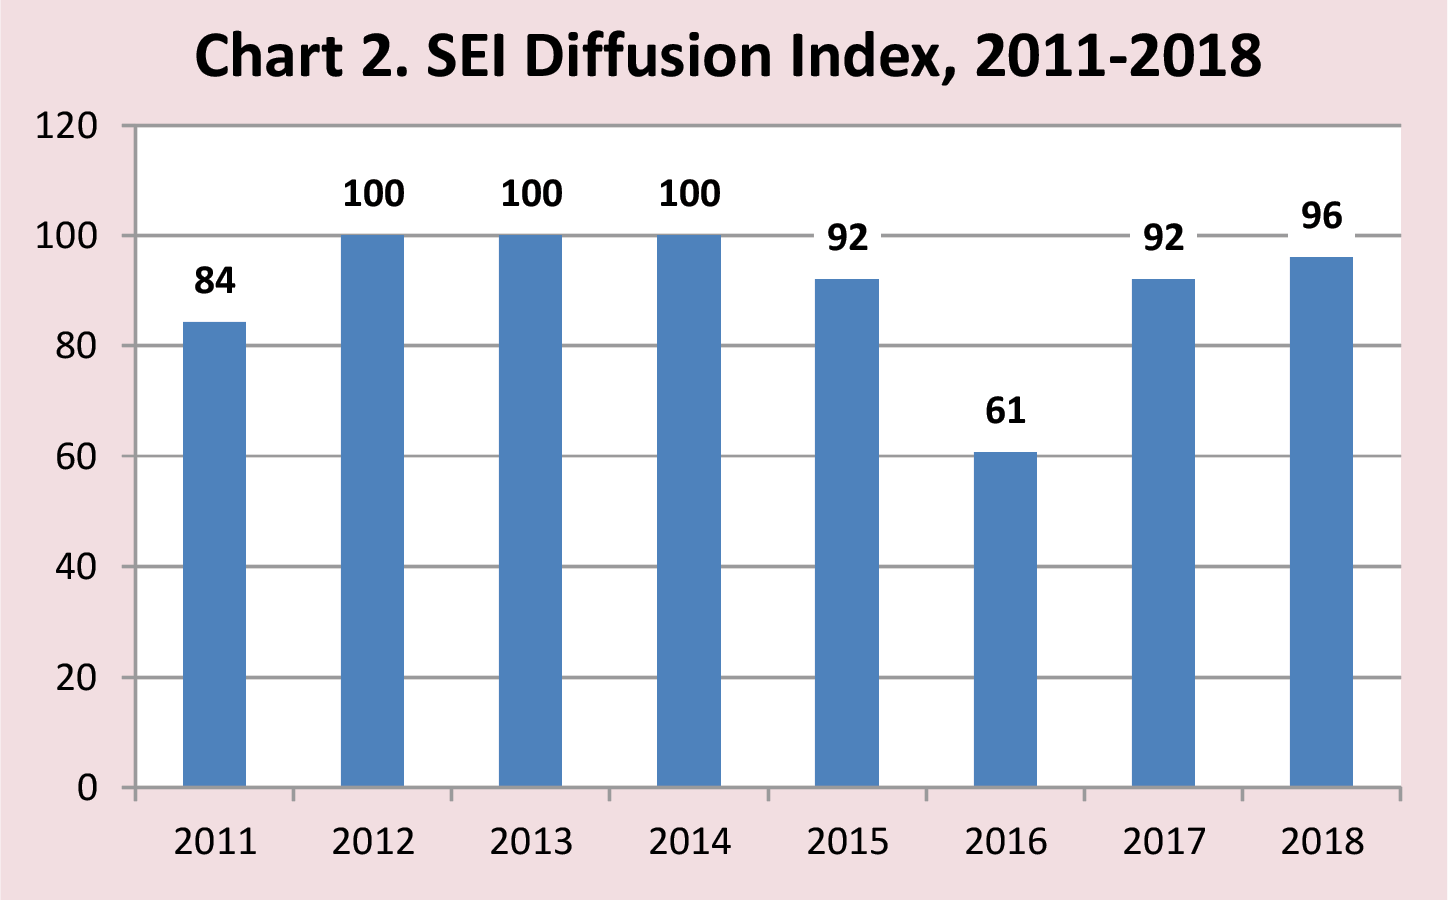
One way to measure aggregate performance of SEI of all 50 states and DC is to use a diffusion index. For each state, the index is up, down, or unchanged over the year. The SEI Diffusion Index is calculated by subtracting the share of states that experienced decreases in their indexes from the share that had increases over the year.
For example, index values in 46 states rose (90%), three (6%) fell, and two stayed the same in 2011. The diffusion index is then calculated by subtracting 6 from 90, equaling 84. Thus, if all 51 state indexes increase from a prior year, then the diffusion index becomes 100, and if all decline, then -100. If the SEI Diffusion Index is positive, then that is interpreted as an economic recovery or expansion, while negative figures would mean an economic recession or contraction.
As expected, in the last seven years, during which the nation was in the midst of an economic recovery, the SEI Diffusion Index has posted strong numbers. Although the national economy had weakened somewhat in 2016, last year’s index, at 96, was the best since 2014 (Chart 2).
Conclusion
Based on the SEI calculations, almost all states fared better over the year, and have contributed to a continued modest national economic growth since 2010. In fact, all states but one increased in 2018 showing that growth was widespread throughout the country with Connecticut's increase slightly below the national average.
 |


