Long Term Industry and Occupational Projections: 2016-2026
By Matthew Krzyzek and Patrick J. Flaherty, DOL
Connecticut’s employment is projected to increase by more than 110,000 jobs over the ten-year period ending in 2026. This 5.9% increase is a bit slower than the 7.4% projected for the U.S., but both state and national projections assume full employment in 2026. With the unemployment rate currently low, total job growth is limited by growth in the population/labor force.1 Every two years, the U.S. Bureau of Labor Statistics produces 10 year projections of the U.S. labor force and employment by industry and occupation. The latest projections are for the period 2016 to 2026. This process is replicated at the state level to produce projections that provide a detailed overview of the expected direction of labor markets in Connecticut.
U.S. Labor Force
The overall U.S. labor force is projected to increase by 10.5 million workers from 2016 to 2026 (a 0.6% annualized growth rate) with increases of 4.5 million men and nearly 6 million women. The labor force is projected to be older and more diverse. The number of white non-Hispanics in the labor force is projected to decline by 2.5 million, while the number of workers of Hispanic origin is projected to increase by over 8 million. The number of Black or African-American workers will be up by 1.9 million and the number of Asian workers up by 2.6 million. The number of workers aged 55 and over is projected to increase by 6.4 million, while those aged 25 to 54 will increase by 5.4 million. The number of workers under age 25 is expected to decrease by 1.3 million.
U.S. Industry Projections
The aging of the U.S. population is expected to increase the demand for Health Care & Social Assistance. That industry sector is expected to add just under 4 million jobs, which will be 35% of the 11.5 million expected total employment increase through 2026. The next two industry sectors with the largest expected increases are the Professional, Scientific & Technical Services and the Accommodation & Food Services sectors, which are expected to add 1.2 million and 1.1 million jobs, respectively. These are less than the employment gains seen in the past 10 years. Construction is expected to gain 864,700 jobs through 2026, not quite making up for the 980,200 construction jobs lost nationally from 2006 to 2016.
U.S. Occupational Projections
Demographic trends also drive the occupational projections. Three of the top growth occupational groups—Healthcare Practitioners & Technical Occupations, Personal Care & Service Occupations, and Healthcare Support Occupations—are expected to grow by a combined 3.6 million jobs through 2026. Many of these occupations are related to the Healthcare industry sector and account for 31% of total projected job growth. The Personal Care and Service Occupations also cover a variety of other occupations, but 63% of the growth in that group is Personal Care Aides, an occupation that assists elderly and disabled persons at home or in a care facility. Food Preparation and Serving Related Occupations is another high-growth group that is expected to add 1.2 million jobs.
The only major occupational groups expected to lose employment over the 10-year projection period are Production Occupations (down 406,000 jobs) and Farming, Fishing, and Forestry Occupations (down 3,500 jobs). The declines in production occupations are commensurate with expected U.S. declines in Manufacturing, with losses in the manufacturing industry projected to be smaller than those seen in the past ten years. Manufacturing industry employment declined by almost 2 million jobs in the 2006-2016 period, with all losses occurring before 2011.
CONNECTICUT PROJECTIONS
Connecticut’s total employment is projected to grow by 111,164 jobs, an increase of 5.9 percent from 2016 to 2026. This increase encompasses private payroll gains of 97,758 (6.1%), slight government losses of 979 (-1.1%), and self-employment growth of 14,385 (7.9%).
Population Change
As discussed in the December 2017 issue of the Connecticut Economic Digest2 Connecticut’s population is expected to grow slowly overall but with a decrease in the population under age 25 and an increase in the number of those age 55 and over. As the industry projections show, Connecticut’s changing demographics will lead to an increase in demand for health care and decreasing demand for educational services.
Industry Projections
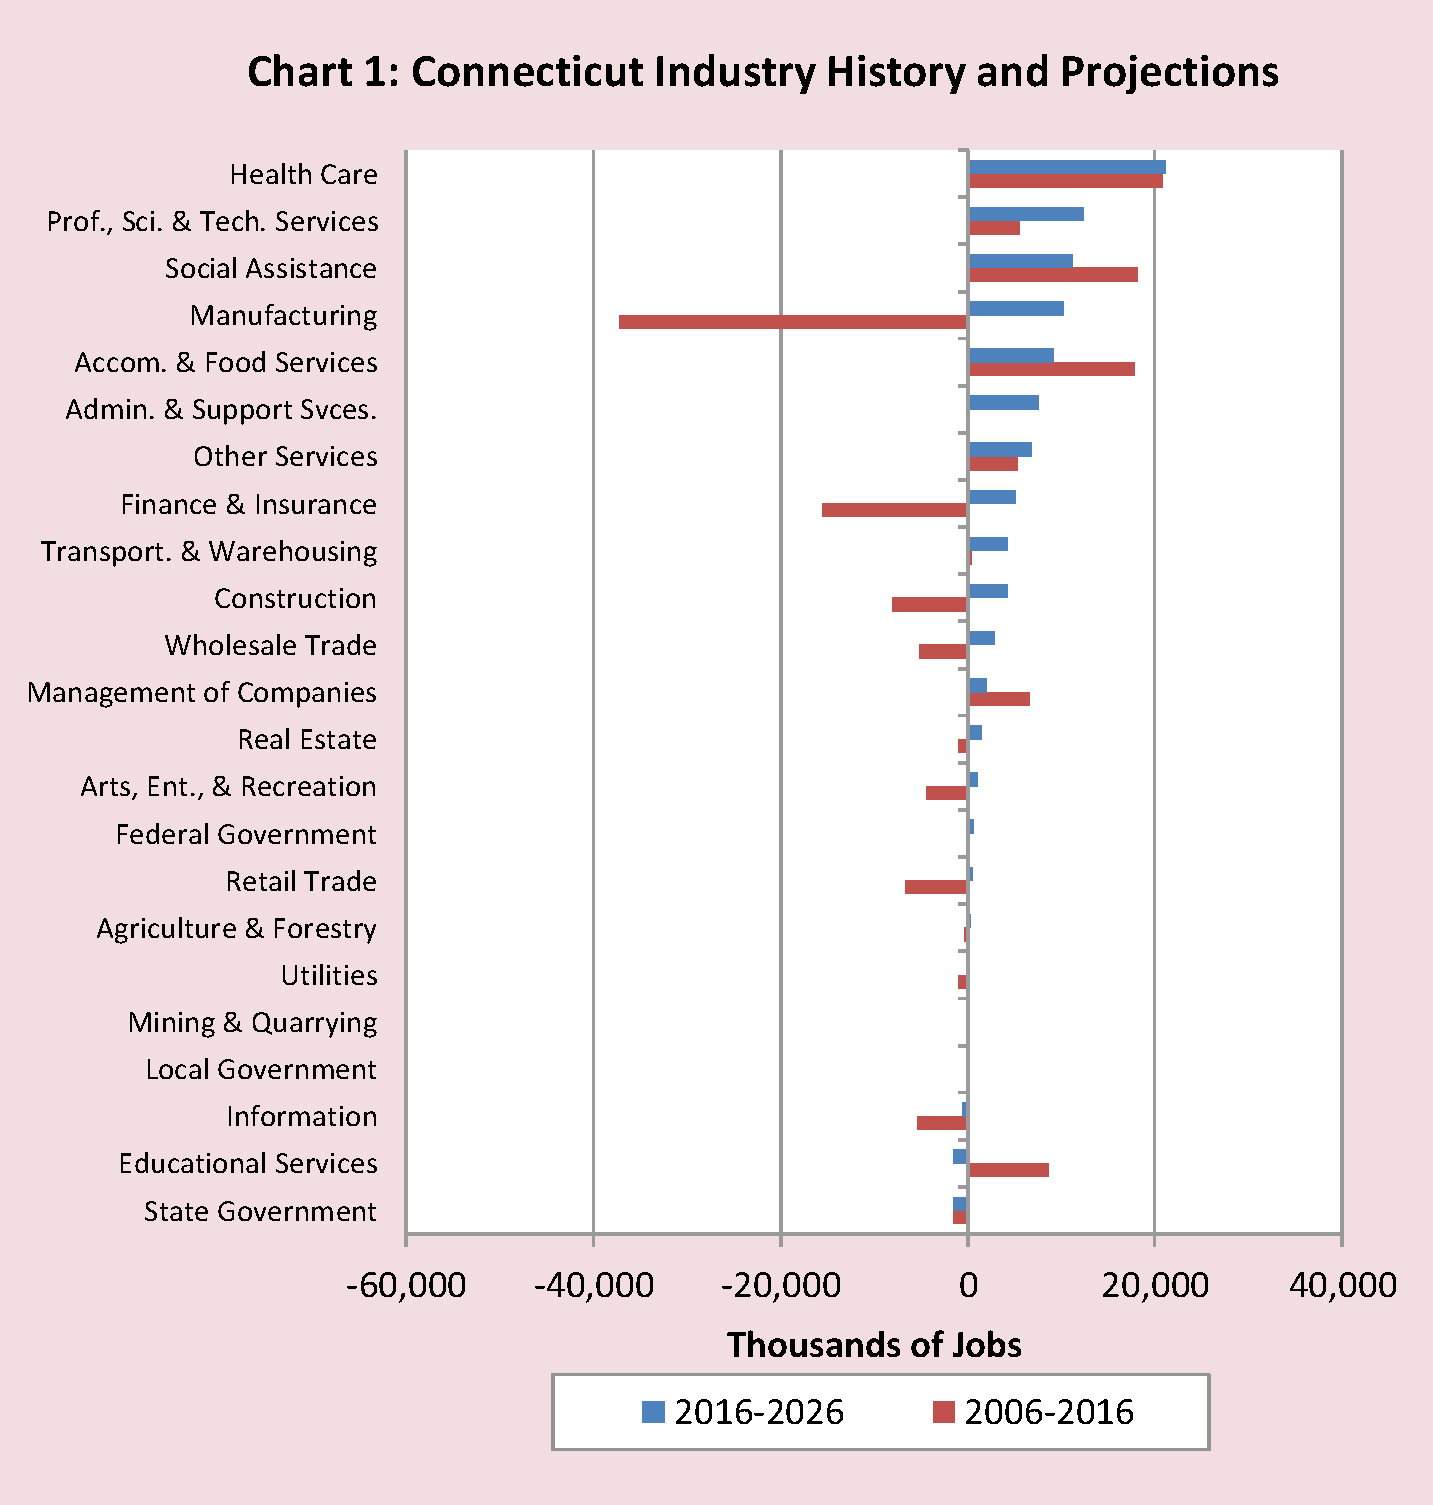
Heath care is expected to add the most jobs through 2026, up 21,163 or 9.5% over 2016 levels (Chart 1). This sector has consistently added jobs for decades and is driven in large part by the aging population. Its expected 10-year increase is comparable to the 21,202 jobs added from 2006 to 2016. In total, 22% of expected job gains through 2026 will be in health care. Other sectors with significant job gains are Professional, Scientific and Technical Services (up 12,341 jobs, or 12.7%), Social Assistance (up 11,166 jobs, or 17.7%) and Manufacturing (up 10,197 jobs, or 6.5%). The projected gains in Manufacturing represent a notable long term labor market shift for Connecticut. That sector had been on the decline since at least the early 1990s and has had relatively flat employment since 2010. Connecticut’s manufacturing employment is projected to grow despite declines at the U.S. level, a rebound that is a significant bright spot for the state economy. Labor force demographics will present challenges to achieving this growth. Manufacturing sector has a higher percentage of workers over age 54 than the overall Connecticut economy (35% and 26%, respectively in 2017).3 Connecticut will need to produce enough manufacturing workers to take the projected new jobs and replace workers who will retire before 2026. Other sectors where Connecticut’s industry employment projections differ from the U.S. are Educational Services and Government.4 In the U.S., Educational Services is expected to grow by 14.2% over ten years, almost twice the growth rate of the overall U.S. economy, while in Connecticut a slight decline of 0.8% is projected. This decline is driven by demographic shifts, namely a decreasing school-aged population in Connecticut. Education was one of the few sectors that saw stable to increasing employment during the Great Recession, but jobs in this sector have decreased every year since 2014. Connecticut’s Government sector employment is also projected to decline over the next 10 years, driven by expected losses at the state level (-5.6%), with local government employment flat. Federal government employment (a small sector in Connecticut) is expected to increase by 1.1%. Most industries in Connecticut are expected to continue to add jobs. Transportation & Warehousing has been boosted by a change in consumer shopping patterns and Professional, Scientific & Technical Services is projected to increase on the strength of Computer Systems Design & Related Services, an industry which includes many Information Technology (IT) and related companies.
Occupational Projections
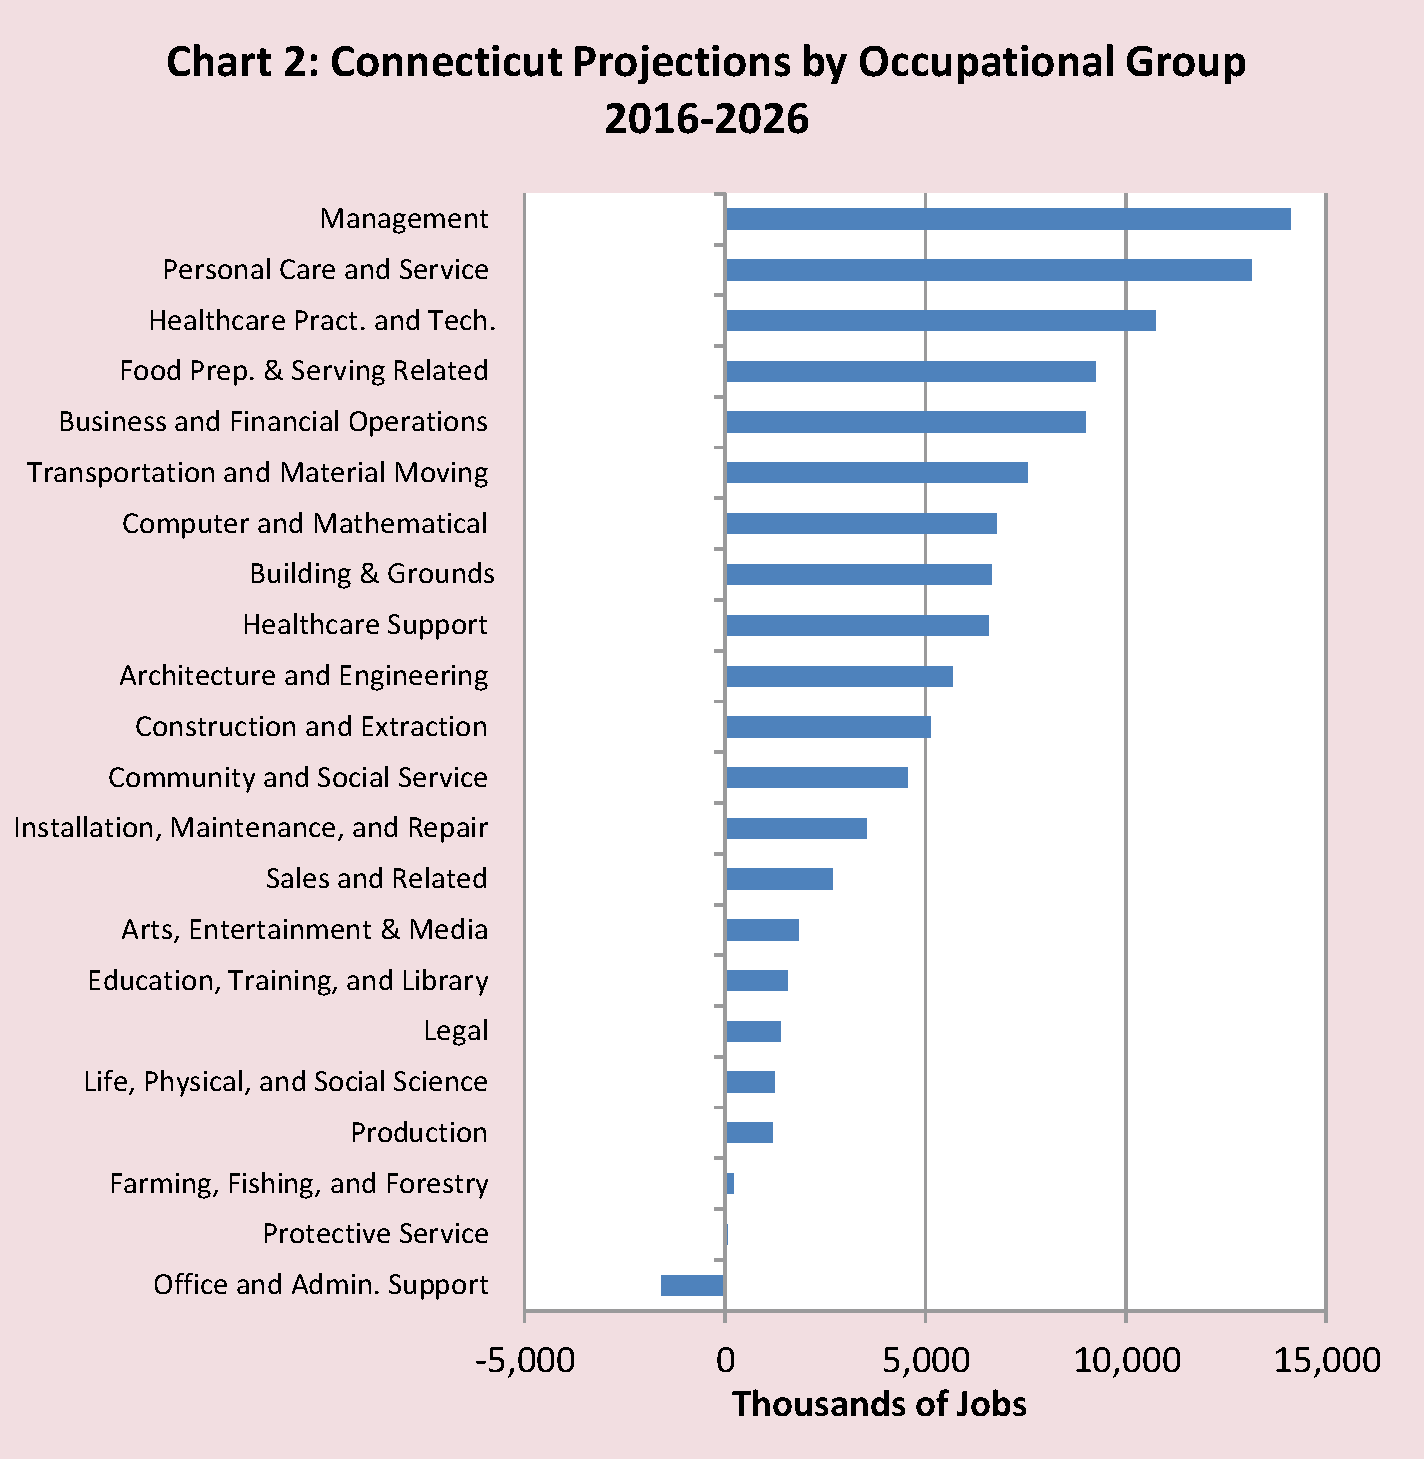
Almost every major occupational group is expected to add jobs through 2026 (Chart 2). The largest major occupational group increases are expected in Management (up 14,116, or 9.7%), Personal Care & Service occupations (up 13,130, or 13.6%) and Healthcare Practitioners & Technical Occupations (up 10,730, or 9.5%). These three occupational groups collectively account for 34% of occupational growth and were 19% of 2016 employment. The only major occupational group expected to lose jobs through 2026 is Office & Administrative Support Occupations, which is projected to decline slightly by 1,594 jobs (-0.6%).
Architecture & Engineering and Computer & Mathematical Occupations
Science, Technology, Engineering & Math (STEM)-related occupations such as Architecture & Engineering (up 16%) and Computer & Mathematical (up 13%) are expected to grow significantly faster than overall employment (up 5.9%). These are the largest and third largest percent increases among occupational groups. Connecticut’s growth in Architecture & Engineering occupations is expected to be more than twice as fast as U.S. growth. Engineers make up the largest component of this category, 23,473 of 35,407 jobs in 2016, with an expected growth rate of 16.7% through 2026.
Computer & Mathematical occupational growth in Connecticut is just slightly below the projected U.S. rate of 13.7%. Computer occupations comprise almost 49,000 of the 52,000 2016 employment in this group. The largest of these occupations is Software Applications Developers, which is expected to grow by a substantial 29.3% over ten years.
STEM-related occupations are not only growing faster than the economy as a whole, they also have higher earnings. The average annual wage for Architecture and Engineering Occupations is $85,619 and $90,570 for Computer and Mathematical Occupations.5 In total, 11.2% of the state’s ten- year employment growth is projected to be in these two occupational groups.
Education and Growth
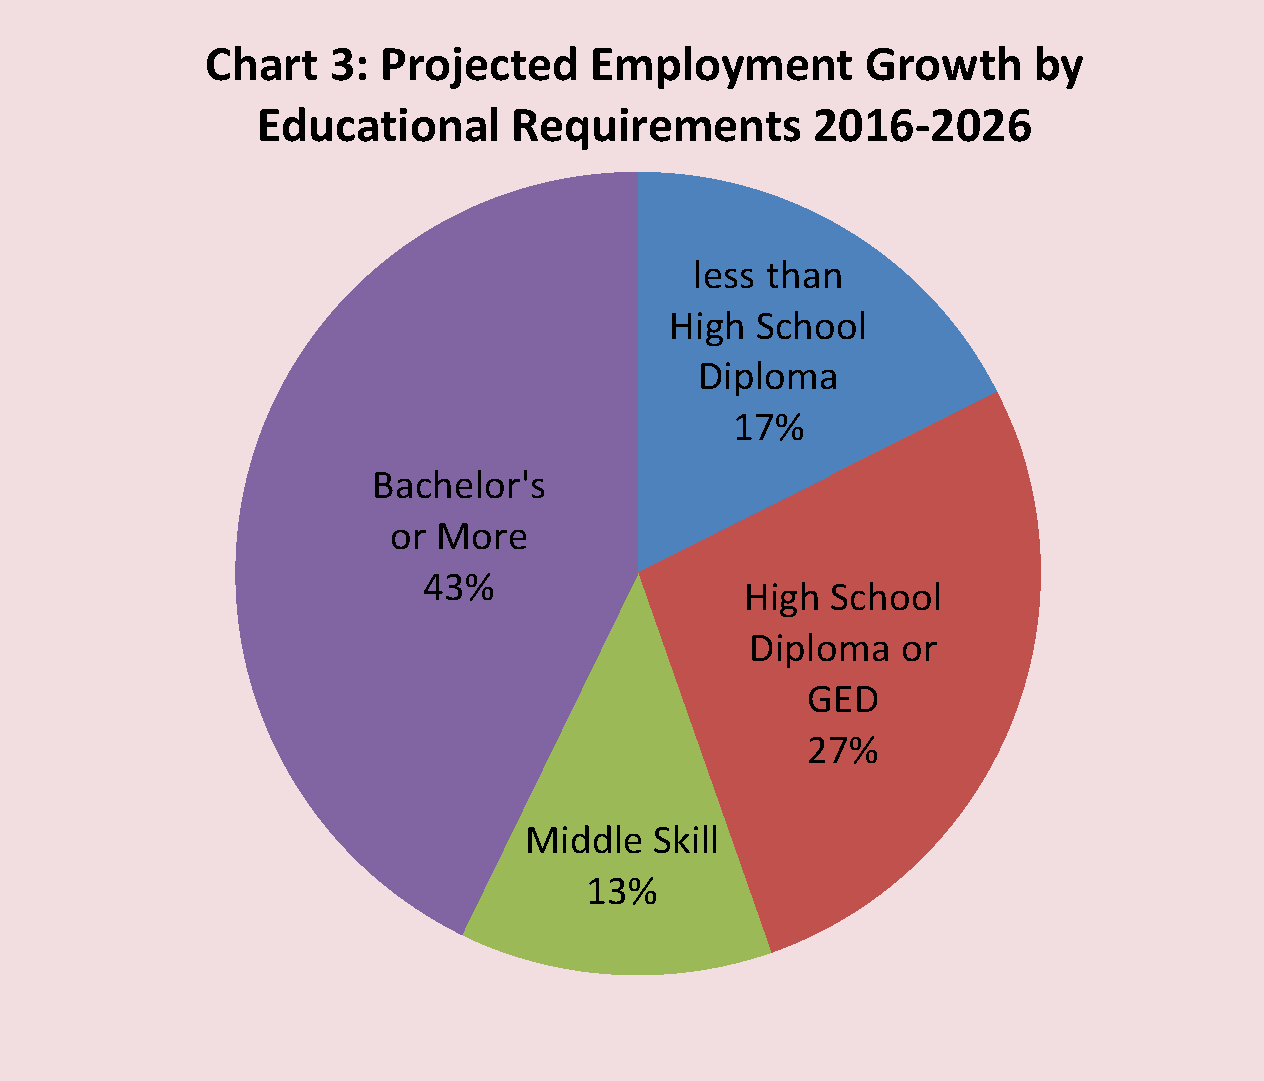
As (Chart 3) shows, a majority of job growth will be in occupations that require more than a high school diploma, with 43% of the employment increase in occupations that require a bachelor’s degree or more.6 The Middle Skill category is occupations that require more than a high school diploma but less than a bachelor’s degree. The Medical Assistants occupation is expected to have the largest 10-year change within the Middle Skills category, increasing by 20.8% to 9,412 jobs by 2026. For the projections, education categories are defined as the minimum educational attainment necessary to enter the occupation. Many jobs within each occupation require additional education or training. For example, an occupation that needs only a high school diploma to enter the occupation may include some jobs that require an additional credential – so there will be many more jobs in the “middle skill” category than seems apparent by looking only at occupations.
Job Growth, Wages, and Education
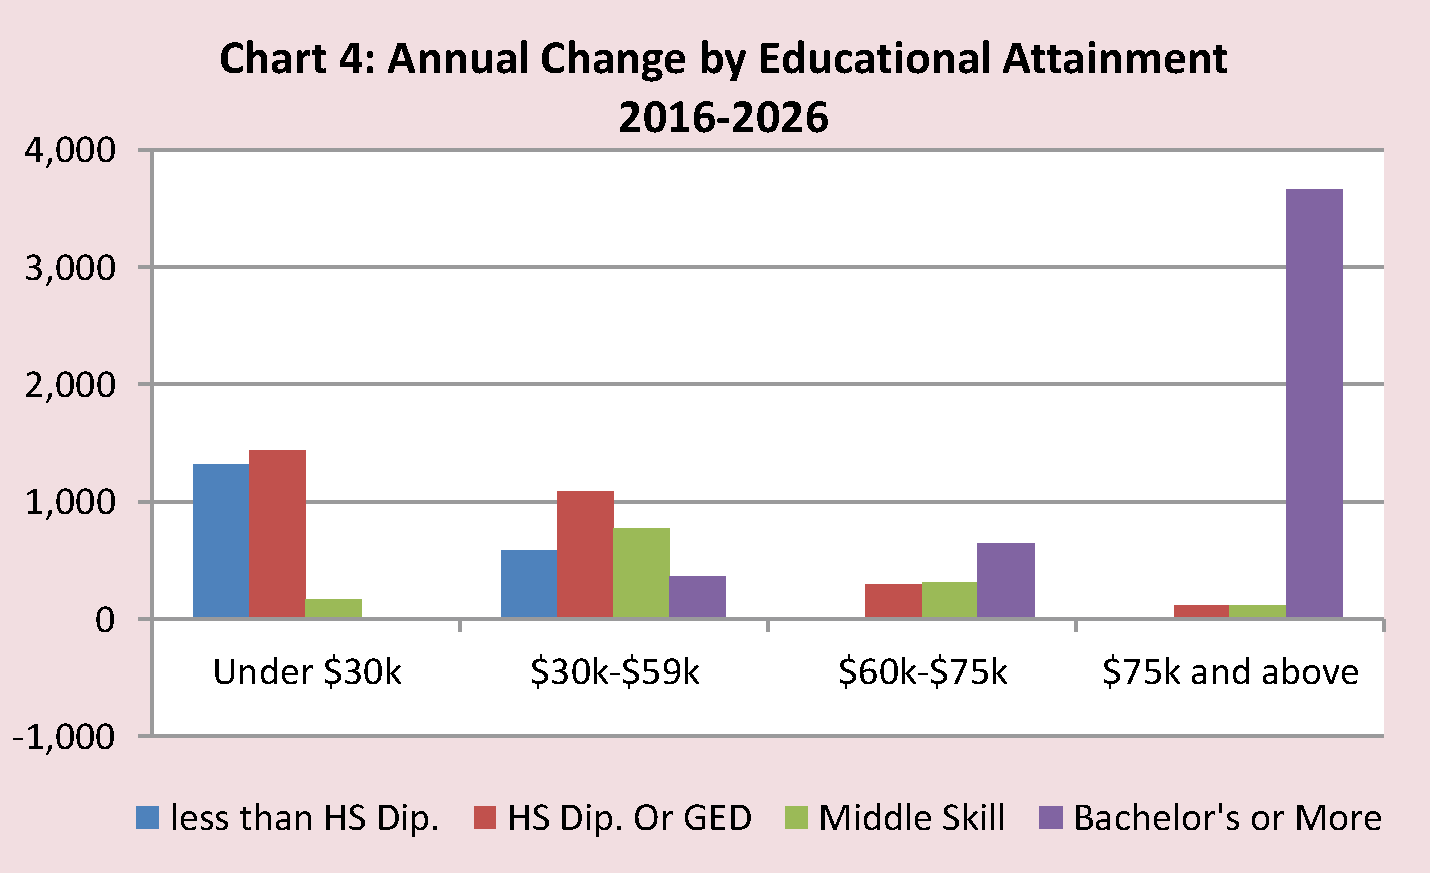
More than 35% of the job growth is projected to be in occupations where the current median wage is $75,000 per year or more, but 94% of that growth is in occupations where the minimum education necessary to enter the occupation is a bachelor’s degree or more. At the other end of the earnings spectrum, 26% of job growth will be in occupations with median earnings less than $30,000 per year, with 95% of these jobs in occupation where the minimum education requirement is a high school diploma or less. As (Chart 4) shows, the higher the educational attainment, the more growth is projected in occupations with higher median earnings.
Job Growth vs. Job Opening
The labor market is dynamic. While most of this article has been focused on job growth, this is not the source of most job openings. Most openings occur when someone separates from a position either to leave the labor force (such as retirement) or to take another job – leaving an opening that needs to be replaced. In previous projections cycles, the Bureau of Labor Statistics (BLS) and the states including Connecticut estimated the number of replacement openings needed to be filled by new entrants into the labor force. Beginning with this projections cycle, BLS has adopted a new methodology to recognize the fact that most jobs are filled not by people entering the labor force but by workers who are moving along a career path from one job to another. This new methodology significantly increases the number of reported openings due to separations from a job. While this gives a more accurate view of the occupational change workers make throughout their careers, it is important to note that the increased openings reported in this round of projections is due to a methodology change in the estimation process, not due to increased demand for workers in Connecticut.
Conclusions
Demographic trends point to slow population and labor force growth, so overall, Connecticut is projected to add jobs at a slower rate than the nation as a whole through 2026. However, there is projected strength in manufacturing and computer-related industries and in high skill/high paying occupations. This shows that Connecticut can have a prosperous future if the full-employment assumption behind the projections is achieved and maintained.
Accuracy of the Projections – Data Limitations
The long term projections were carefully prepared using all available information as of June 2018. When evaluating the projections it is important to keep a few things in mind. The projections are based on the assumption of a full employment economy in 2026. Given the ups and downs of the business cycle, it is possible that the economy will not be at full employment at that time. The average annual openings are not attempting to predict how many openings there will be in a given occupation in any particular year. As the word “average” suggests, some years will be higher, others will be lower. Finally, while the projections take into account as much currently available economic and labor market data as we can evaluate, there will be changes over the next ten years which no one can anticipate. Our projections are for industries and occupations that currently exist. New industries and occupations that cannot even be imagined today may well become significant by 2026. Connecticut projection details, including details about the new methodology for calculating separations and openings, are available on the Connecticut Department of Labor’s Labor Market Information page at http://www1.ctdol.state.ct.us/lmi/projections.asp. More detailed national projections are available at www.bls.gov/emp.
1 The labor force is that portion of the population aged 16 and over that is working or looking for work.
2 https://www1.ctdol.state.ct.us/lmi/digest/pdfs/ceddec17.pdf
3 US Census. Quarterly Workforce Indicators.
4 In this article, “Government” excludes education and health care. Education includes public and private schools, colleges, and universities.
5 Connecticut Department of Labor, Occupational Employment Statistics https://www1.ctdol.state.ct.us/lmi/wages/statewide2017.asp
6 More information on BLS Occupations can be found at: https://www.bls.gov/ooh/


