Is Connecticut Losing Jobs to Other States?
By Andy Condon Ph.D., Director of Research, DOL
Rightly or wrongly, Connecticut’s job growth performance is often talked about in the context of “winning” or “losing” to other parts of the country. This article uses the location quotient measure to begin to address this issue by using national Quarterly Census of Employment and Wages (QCEW) data to measure relative job growth from and to Connecticut over time.
According to the US Department of Labor’s Bureau of Labor Statistics, location quotients are ratios that allow an area’s distribution of employment by industry, ownership, and size class to be compared to a reference area’s distribution1. To put this into Connecticut industry terms:
% of total CT emp. in industry X
----------------------------------------------
% of total national emp. in industry X
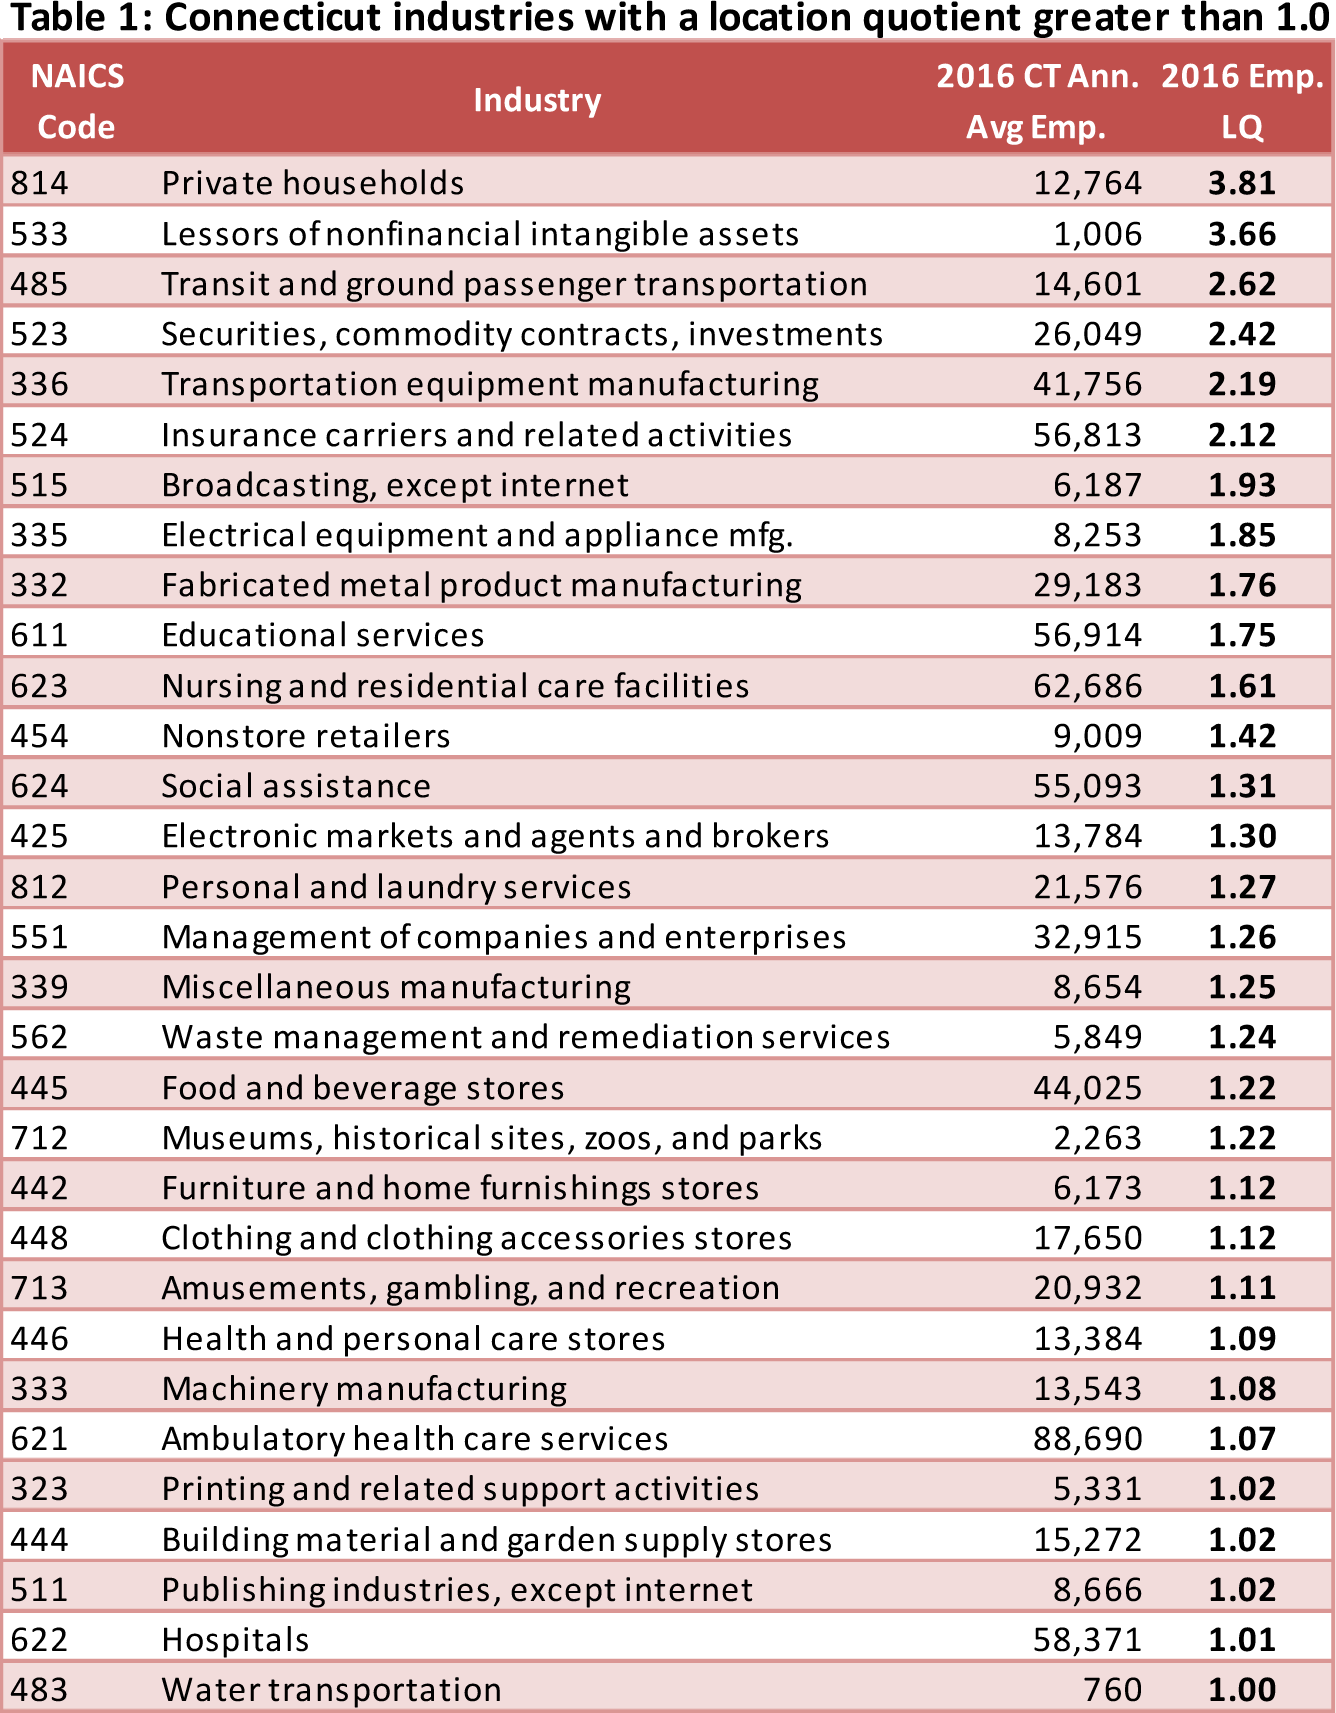
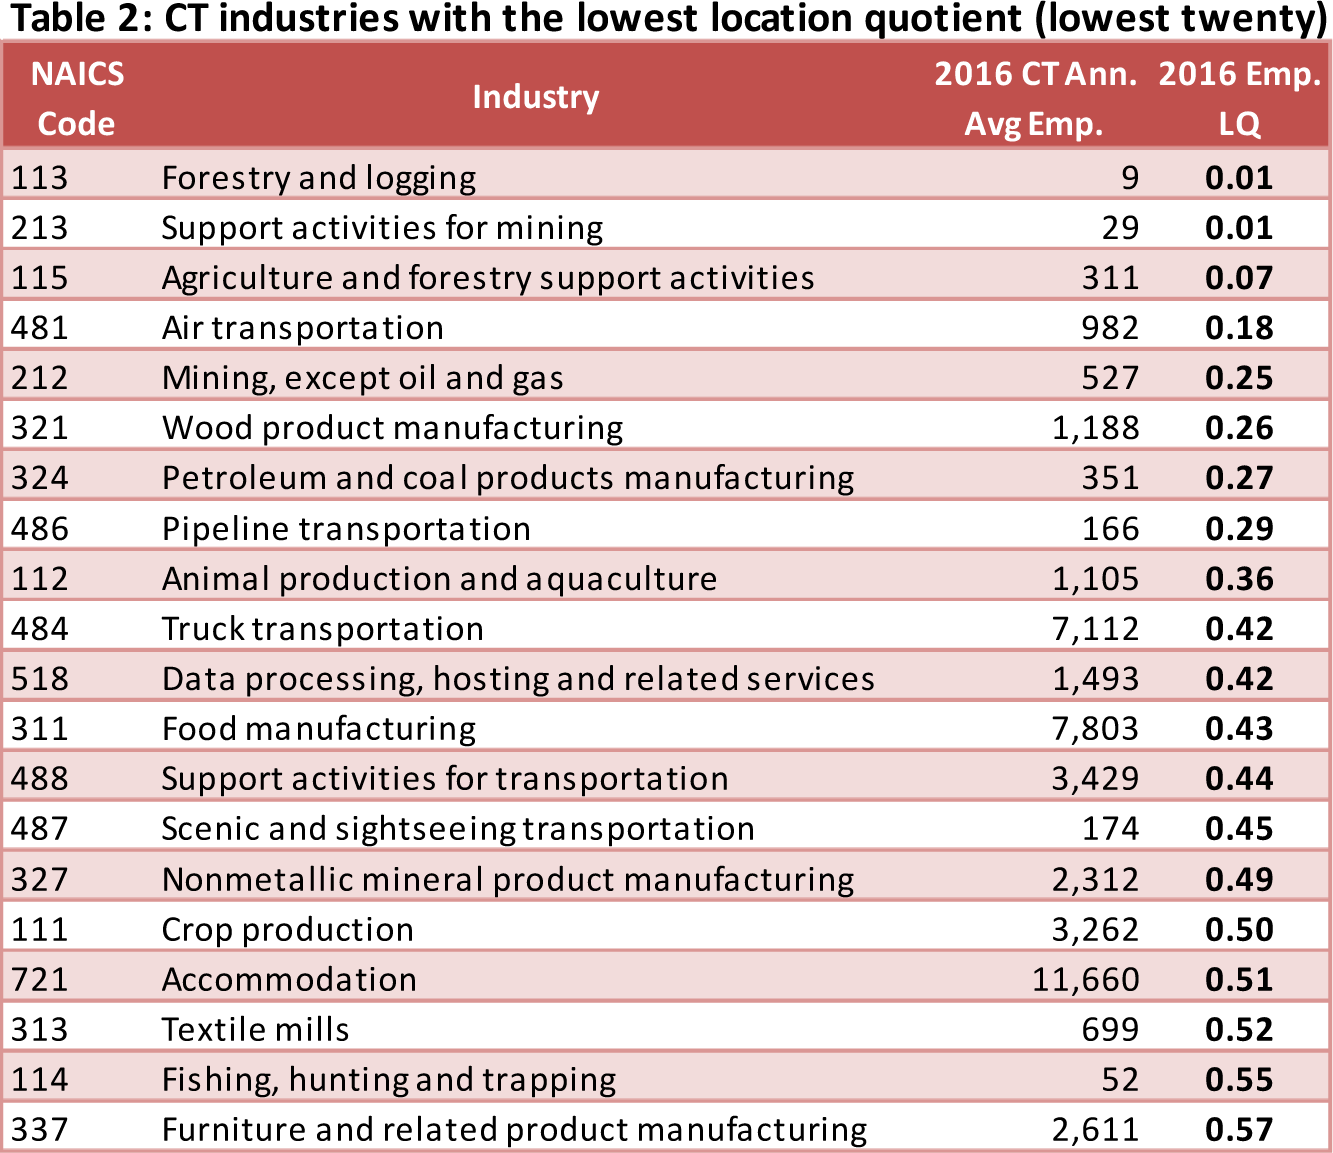
A location quotient = 1.0 means that the percent of industry X employment in Connecticut is the same as percent of industry X employment in the US. For example, the 2016 Connecticut location quotient for printing and related support activities (North American Industry Classification System (NAICS) 323) was 1.02, indicating that the concentration of employment in this industry is essentially the same as that seen across the US as a whole. A Connecticut location quotient of less than 1.0 indicates that Connecticut has a smaller percentage of employment in the indicated industry than does the US. As an extreme example, the 2016 Connecticut location quotient for mining (NAICS 212) is 0.25, confirming that relative to the rest of the US, Connecticut has very little mining activity. A location quotient of greater than 1.0 indicates the Connecticut share of employment in an industry is higher than that of the US as a whole. Not surprisingly, the Connecticut location quotient for the insurance carriers industry is 2.12.
Connecticut 2016 industry location quotients
Table 1 shows the ranking of NAICS industries in Connecticut with a location quotient greater than or equal to 1.0. Note that those industries with the highest location quotients are those with which Connecticut labor markets are often associated, i.e., finance, insurance, broadcasting and aerospace/defense (transportation equipment and fabricated metal product manufacturing).
Table 2 shows those industries with the lowest location quotients in Connecticut. These are most often associated with natural resources, agriculture, and primary product manufacturers. Surprisingly, accommodations are on this list even though it employs a substantial number of people in the state, nearly 12,000 in 2016.
Industry location quotients over time
Comparing the state’s industry location quotients over time will tell us how Connecticut retains or grows employment in comparison to the nation at large. In this analysis industry location quotients are compared from 2005 to the latest available - 2016. Changes in industry location quotients over time indicate that an industry is gaining/losing its relative concentration of employment in comparison to the nation. The chart below outlines the possibilities (Table 2.1).
It is important to note that actual levels of employment over time can be affected by stage of the business cycle, productivity and movement of economic activity to or from overseas.
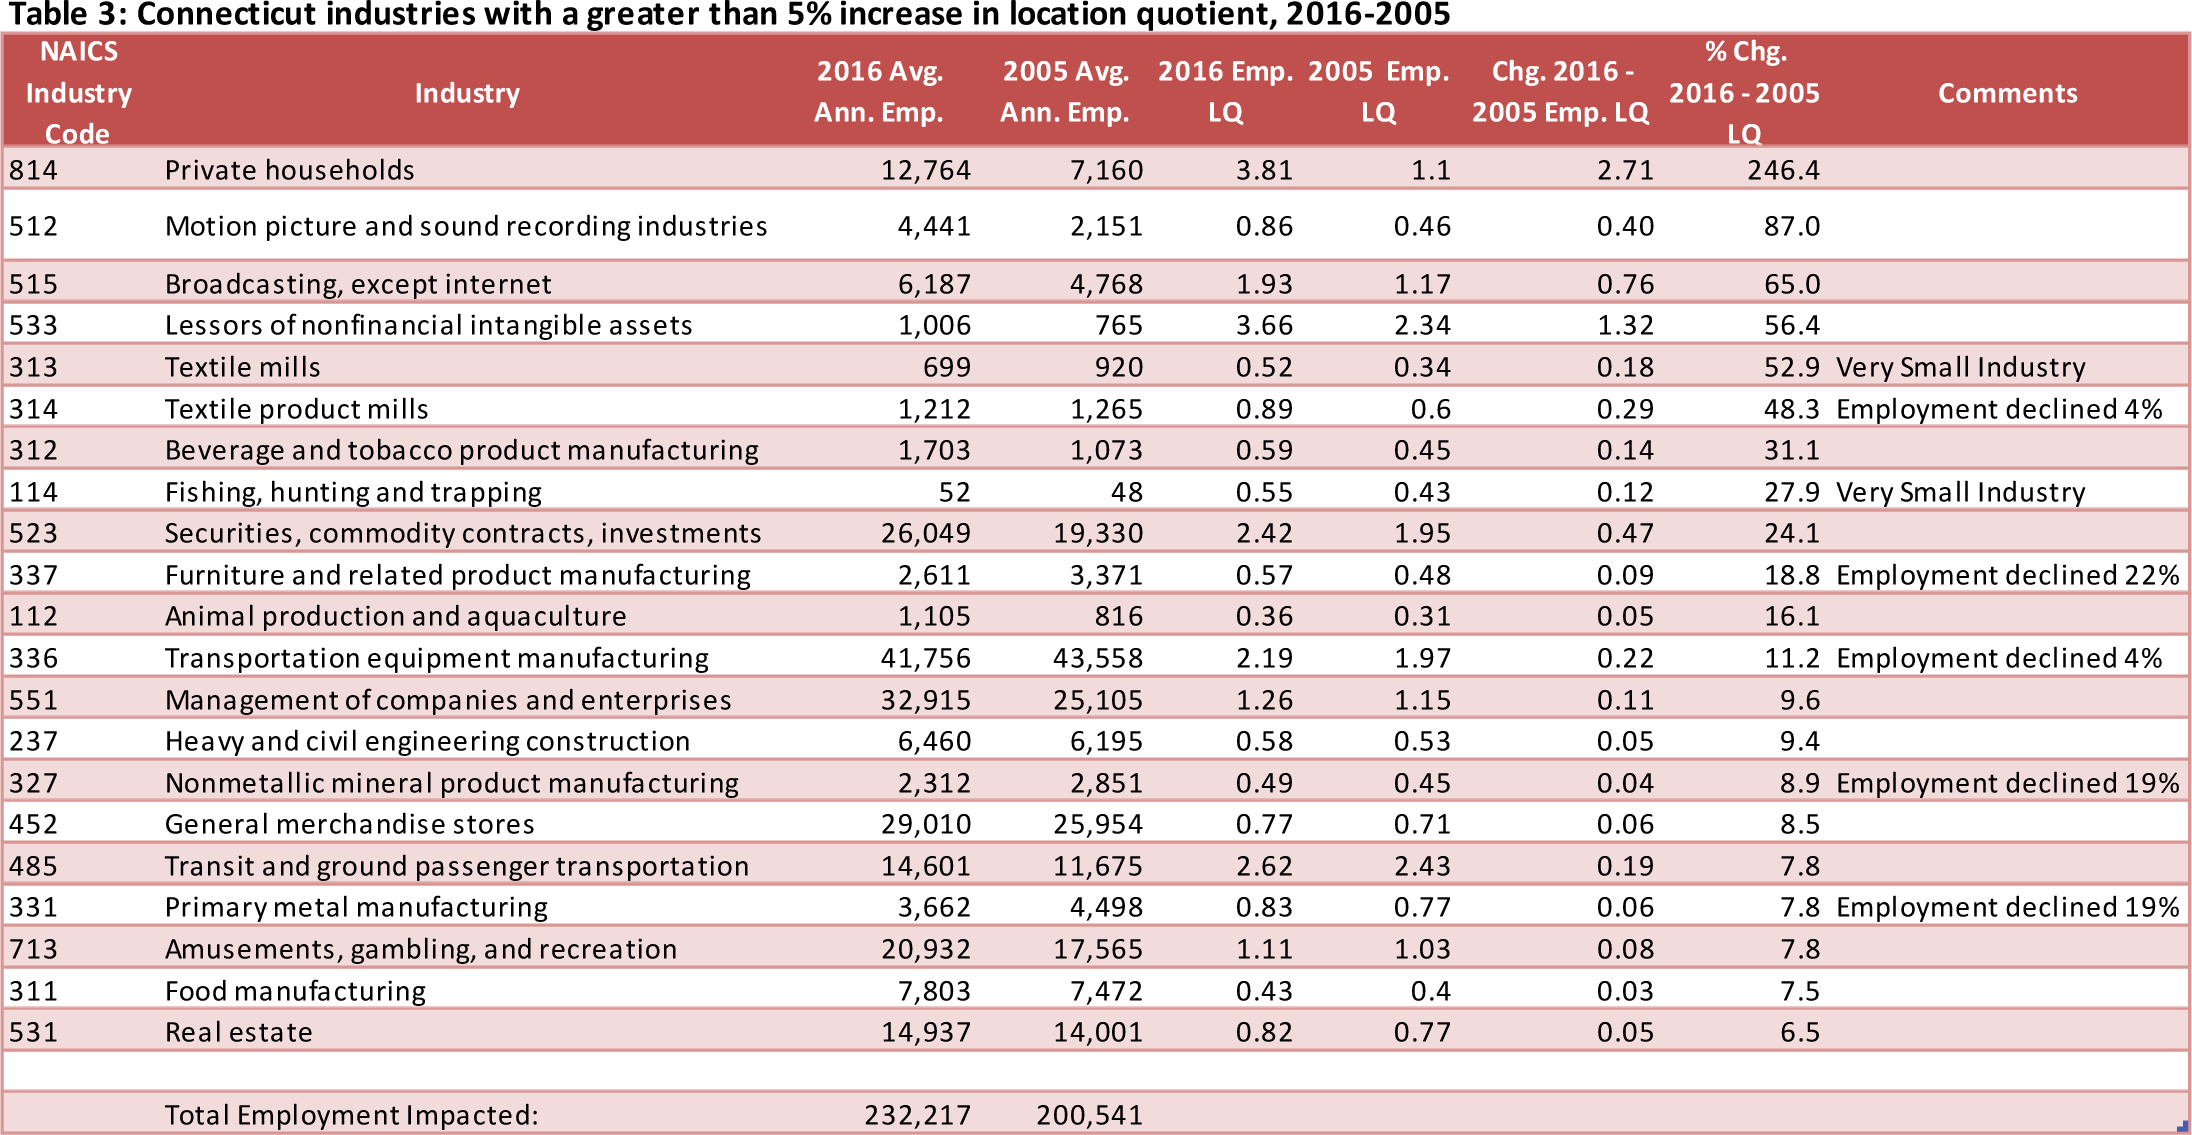
Table 3 shows the ranking of all three-digit NAICS industries in Connecticut whose location quotients have grown over 5% in the 11-year period from 2005 to 2016. In all of these cases, Connecticut industries have gained employment either from other states or relative to other states. In some cases such as motion pictures, textiles, beverages & tobacco, furniture, animal production, heavy construction, nonmetallic mineral production, primary metal food production, and real estate, Connecticut’s location quotient share is small (< 1.0) but growing. In other cases, such as textile products, furniture, transportation equipment, nonmetallic mineral production and primary metal manufacturing, employment has actually declined over time, but their location quotients have improved. The strategic transportation equipment manufacturing industry (driven by aerospace and shipbuilding) has one of the highest location quotients in the state (2.19), an 11% improvement over 2005 and yet employment has declined by 4%. This is likely due to productivity increases in those industries which have lessened labor demand overall, but in which Connecticut has declined relatively less.
The remaining industries have significantly higher location quotients that have improved with time. Private households have increased in employment 78% over the period with a location quotient of 3.81 in 2016. This reflects aging demographics and the increased emphasis on providing care to the elderly at home and not in institutions. The motion picture industry has more than doubled in employment over the period, though the location quotient remains less than 1.0. Broadcasting has grown 30% in employment since 2005. The securities and investment industry has recovered nicely from the recession, growing 35% in employment from pre-recession levels.
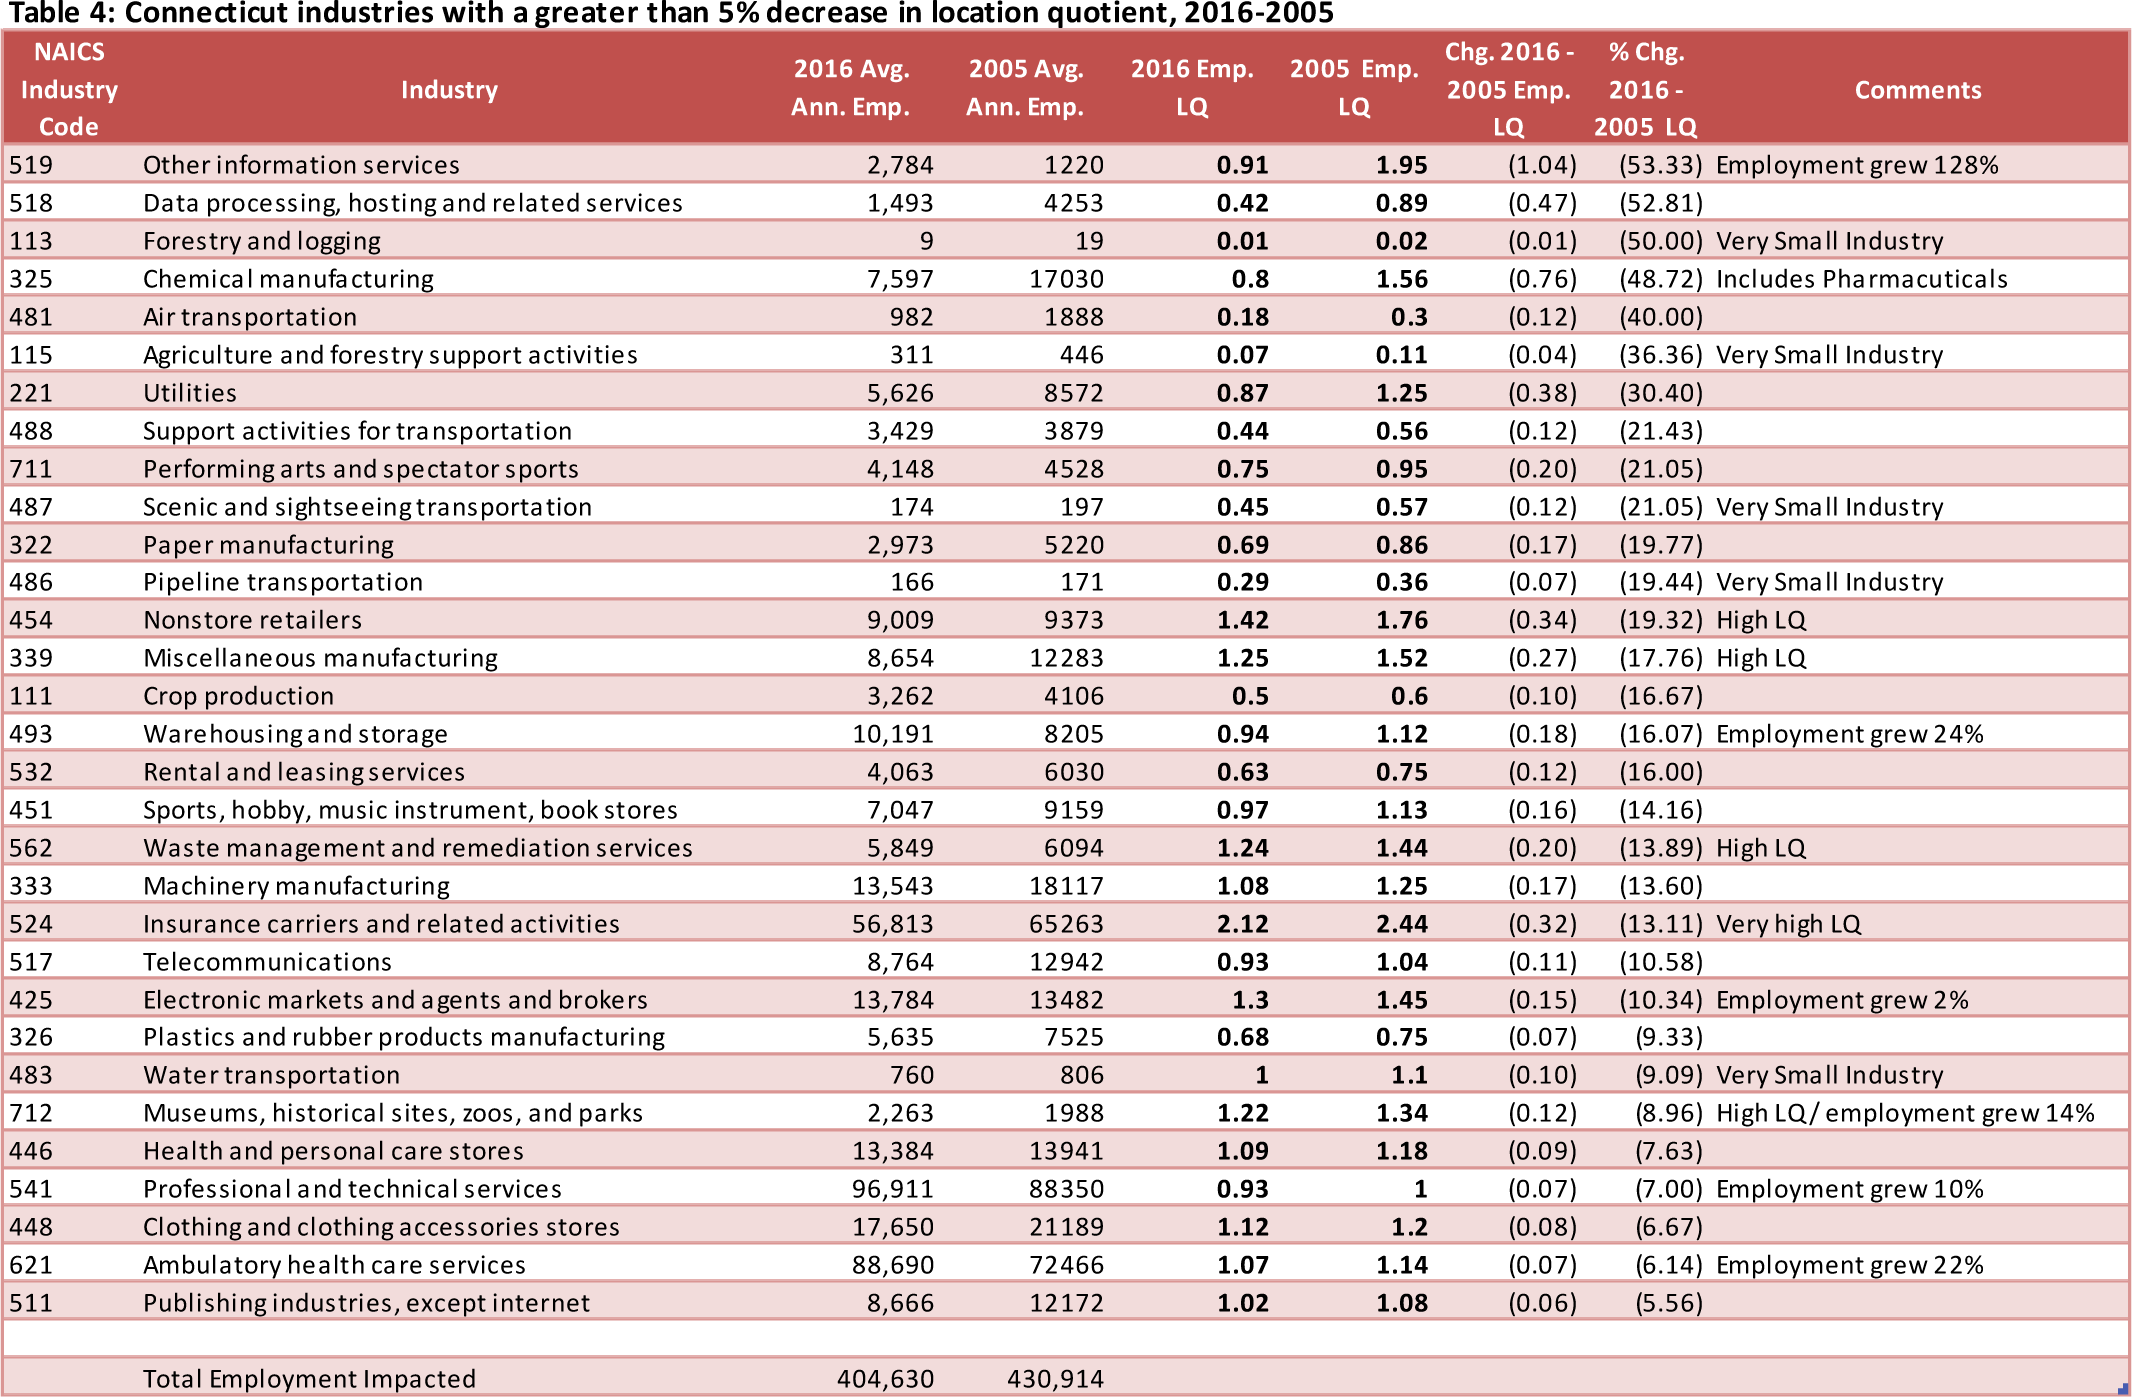
Table 4 shows Connecticut industries at the other end of the spectrum, i.e., those that have seen location quotient declines over the 2005-2016 period. There are a variety of reasons why this may have occurred, but in all cases Connecticut has lost employment relative to other parts of the country.
In most cases, (17 out of 31) the industries have had traditionally low concentrations of employment in the state (location quotients of less than 1.0), and have continued to lose ground. In other cases, the industry location quotients are greater than one, but have declined over time. In these cases Connecticut has maintained a high concentration of employment, but growth has been faster elsewhere. The insurance industry is perhaps the obvious example.
With a location quotient of 2.12, insurance remains a major employment force in Connecticut, but after undergoing restructuring following the recession and increased competition for this employment nationally, its location quotient has fallen from 2.44 in 2005 – a 13% decline. Another notable decline was chemical manufacturing, mostly driven by the exit of pharmaceutical companies.
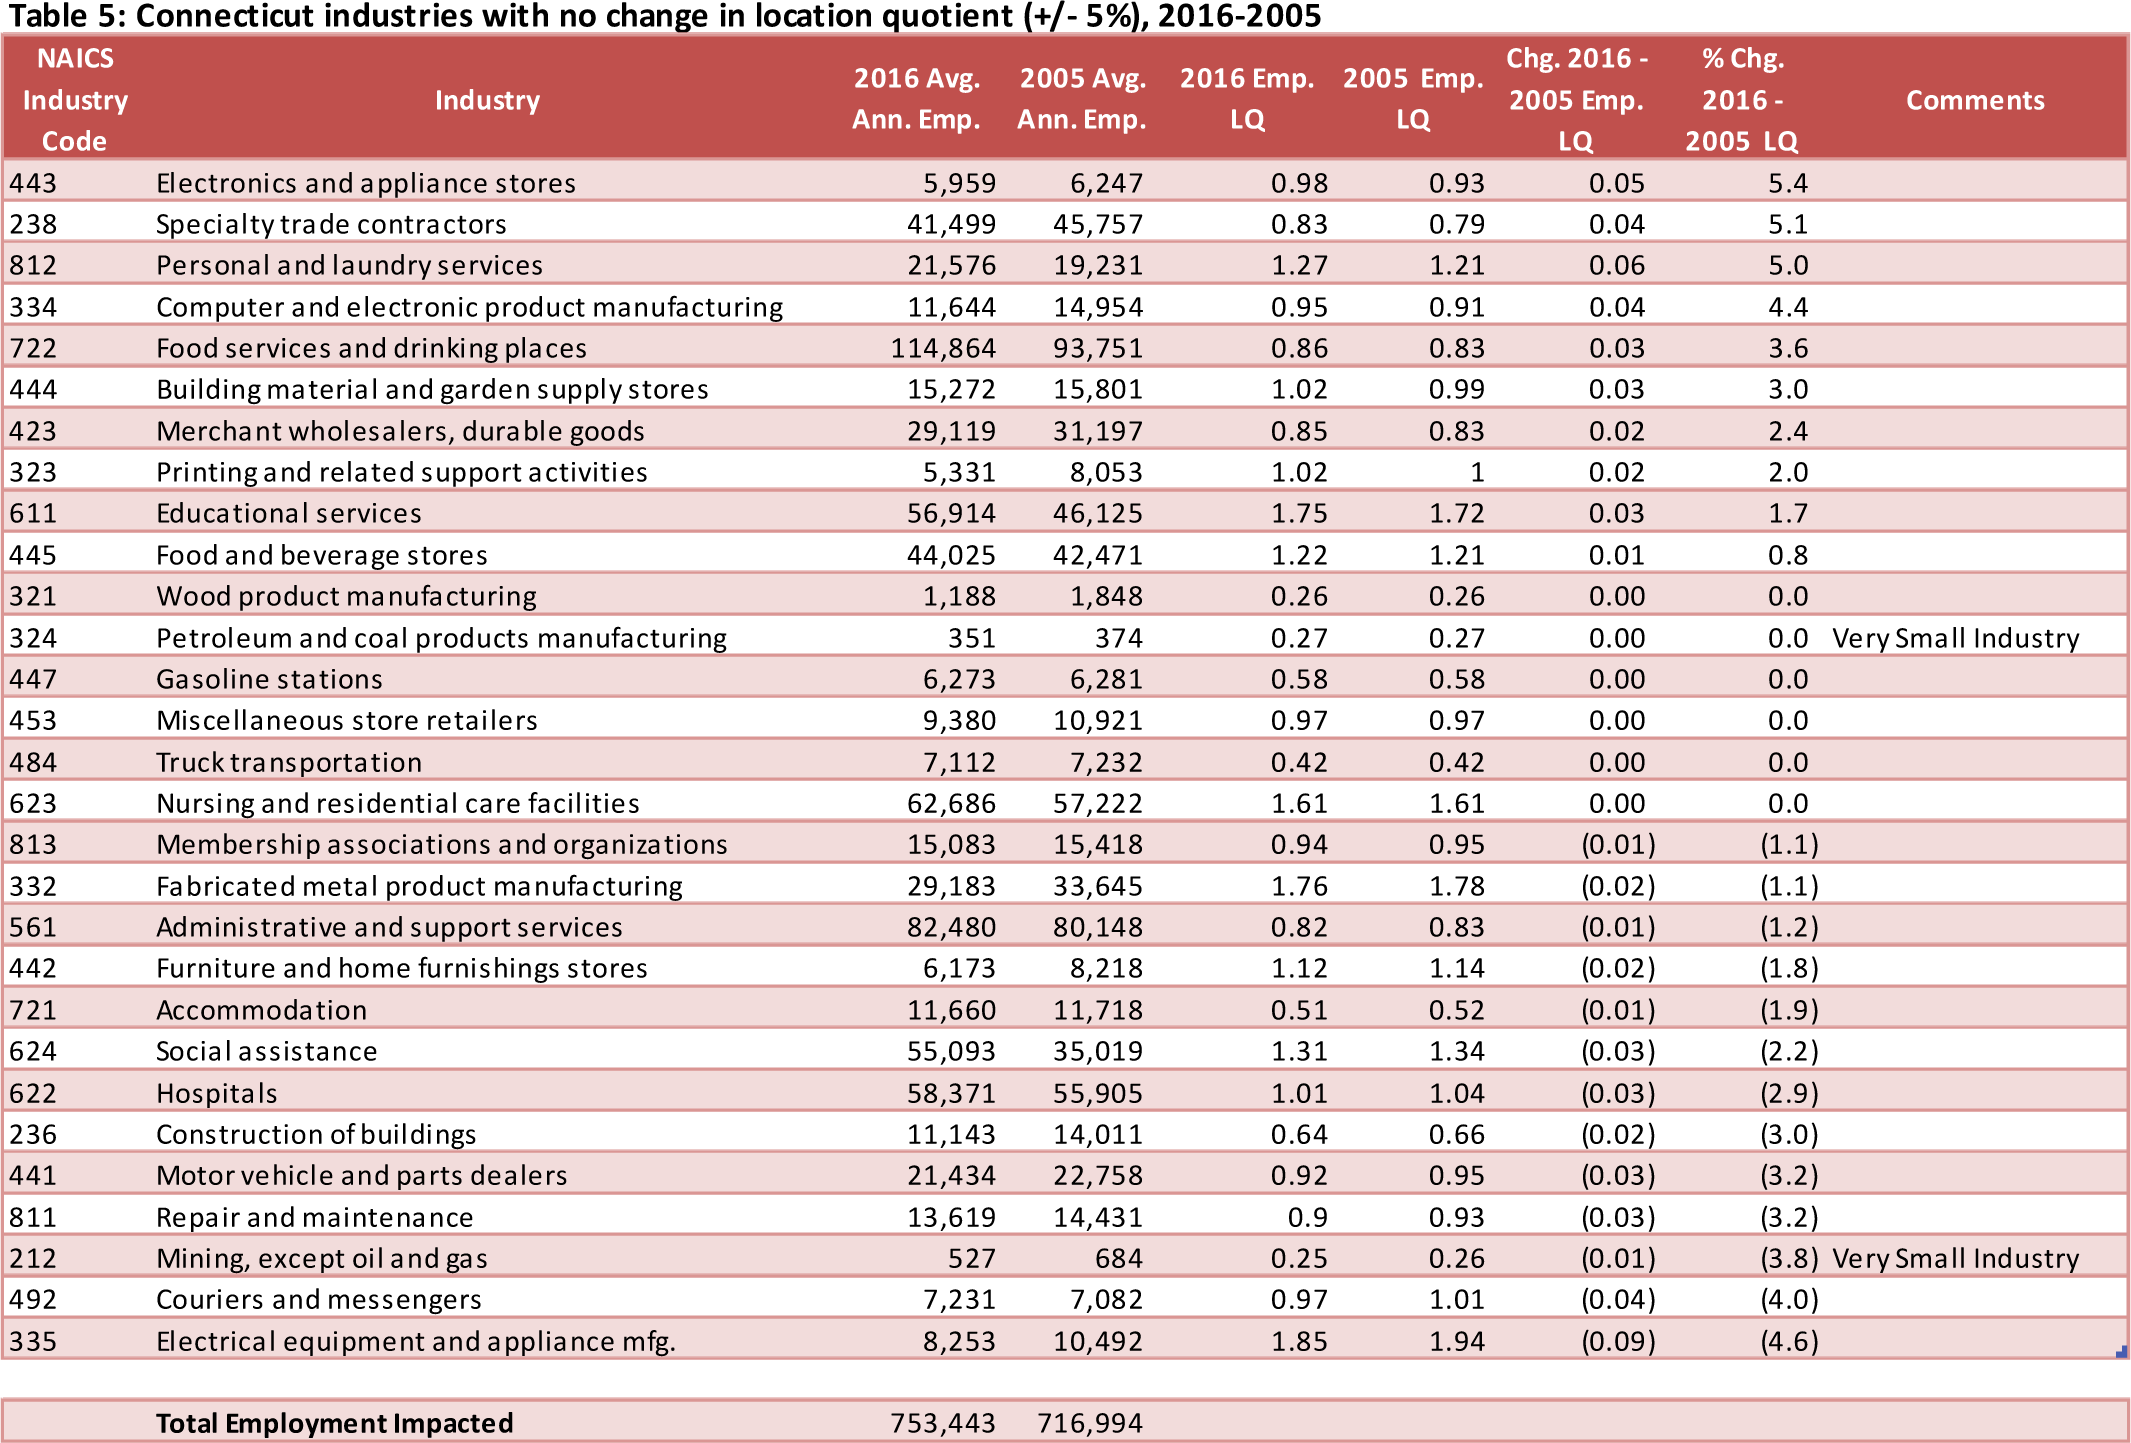
Table 5 shows the remaining Connecticut industries, i.e., whose location quotients have not changed substantially over the 11-year period (5% or less). Though seventeen of the twenty nine industries in this category saw job declines over the time period, overall the group saw a 36,449, or 5%, increase in employment. In most cases these industries have smaller employment shares relative to the rest of the nation (location quotients < 1.0), but ten have higher location quotient shares, including some large employment industries such as education, food and beverage, nursing facilities, social assistance and hospitals.
Summary
Returning to the initial question, “is Connecticut losing jobs to other states,” the answer is nuanced. Twenty one industries have shown substantial increases in location quotient shares in recent years, impacting 232,000 workers in 2016. These industries grew nearly 32,000 workers or 16% in the eleven-year period, despite the impact of a major recession. Combining this group with the group that has held its own, the total number of workers impacted is nearly 986,000 or 71% of the unemployment insurance-covered workers in the state. In all of these industries, employment has either grown relative to the other states in the country or held its own.
However, employment shares have fallen for thirty one industries, including some with large employment, such as insurance, professional and technical services and ambulatory health care. Nearly 405,000 workers are impacted in this group which has lost net 26,000 jobs or 6% over the 11 year period. In each of these cases industry employment shares have declined relative to the nation as a whole.
In the competitive terms, rightly or wrongly framed at the beginning of this article, 71% of Connecticut jobs are in industries that are performing as well or better than the US as a whole with respect to employment growth. On the other hand, 29% of our jobs are in industries that are lagging in employment growth relative to the rest of the nation.
