The Higher Education / Workforce Report
By Patrick J. Flaherty, Assistant Director of Research, Connecticut Department of Labor
 ost graduates of Connecticut’s public colleges and universities work in Connecticut. Graduates from the wide range of programs are working in nearly every industry in our state. Shortly after leaving college, many graduates are employed in retail and food service. However, as time passes they are more likely to move to other industries such as manufacturing and health care. Average wages rise significantly in the years following graduation.
For many years the Connecticut public colleges and universities and the Department of Labor have reported on the workforce outcomes of recent graduates. More recently, this information has become available on-line on the Department of Labor’s website as the “Higher Education/Workforce Legislative Report Card”.1 The on-line report is made possible by P20-WIN, the Preschool through 20 Workforce Information Network. P20-WIN securely links education and workforce data to provide answers to help improve education programs and workforce alignment.2
When looking at this information it is important to note that the Department of Labor has employment and wage information only for payroll employees in Connecticut. If a graduate does not appear in the wage records, it does NOT mean that graduate is unemployed. The graduate may be employed in another state, self-employed, employed by the federal government, in the military, or pursuing additional schooling either in Connecticut or another state.
The most recent Higher Education/Workforce report shows the workforce outcomes for 2015-2016 graduates (most of whom graduated in May 2016) and for the 2016-2017 graduates (most of whom graduated in May 2017). For each of the public colleges and universities there is demographic data, data on employment and wages by industry, and employment and wages by program of study. Employment and wage information is provided for the third quarter after graduation and for the third quarter of 2018 – the most recent wage data available when the report was compiled. Information can be downloaded into tables that can be analyzed using Microsoft Excel or other widely available tools.
As an example of the information that can be learned from the on-line report, this article will examine the 2015-2016 graduates of Connecticut’s community colleges and describe their workforce outcomes in the third quarter after graduation (since most graduated in May 2016, this means the first quarter of 2017) and in the third quarter of 2018 (for most graduates, this is a year and half later).
Women make up 61% of employed community college graduates, ranging for 72% of those from Capital Community College in Hartford to 44% of those from Asnuntuck Community College in Enfield. Asnuntuck also had the highest percentage of employed graduates who were under 25 at the time of graduation (64%), while Capital had the lowest (26%) compared to 48% for all community colleges. A majority of graduates were under age 25 at six of the twelve community colleges.
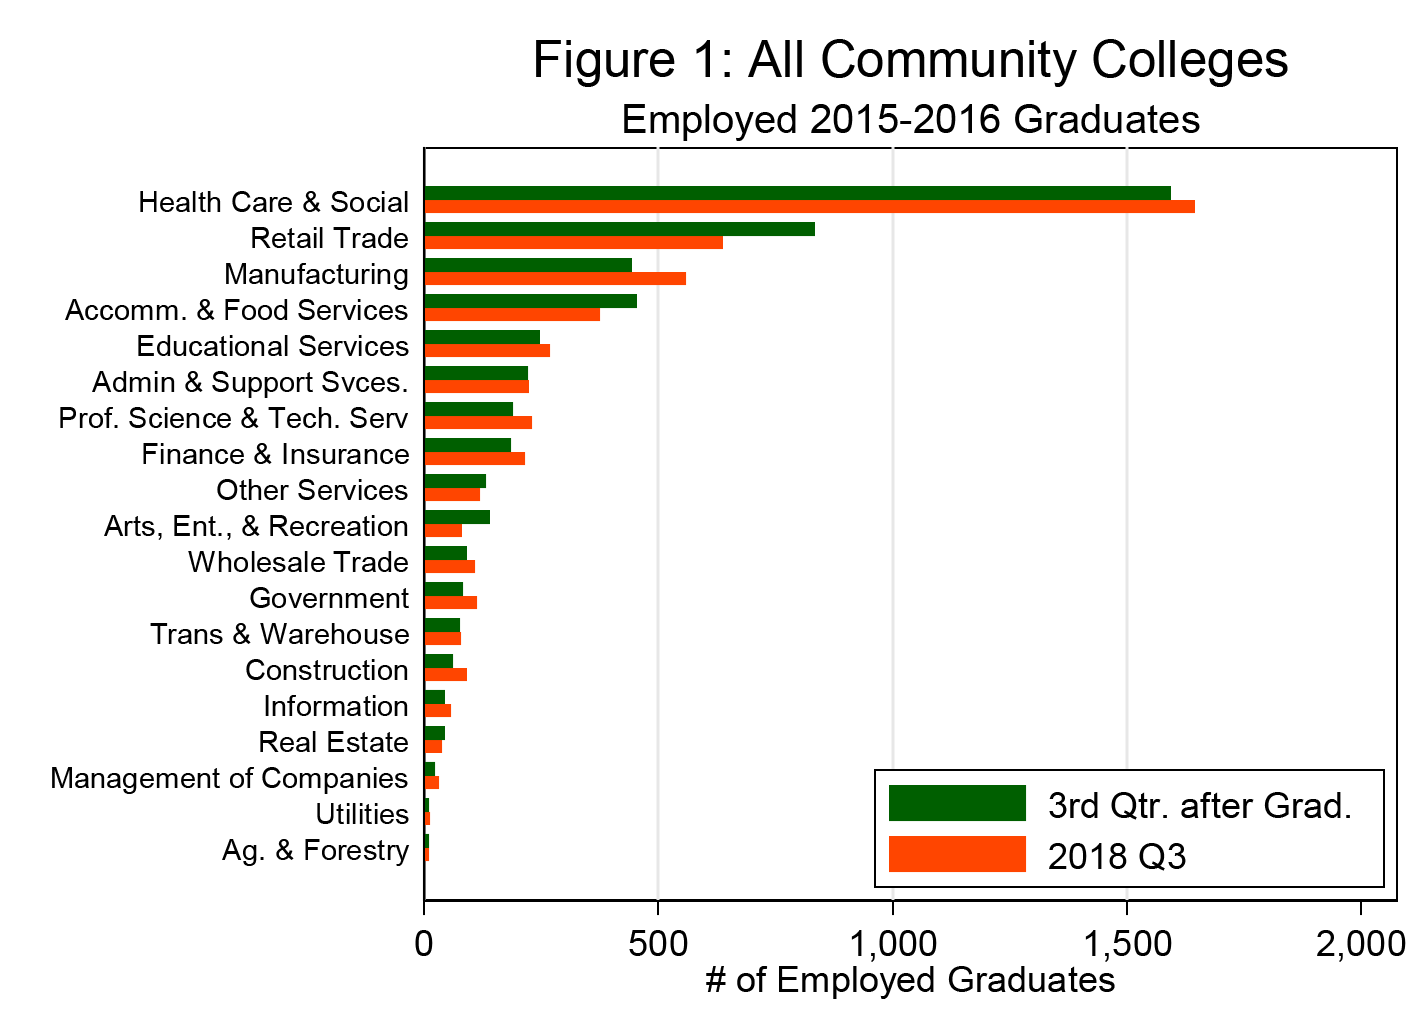
Looking at the 2015-2016 graduates at two time periods allows us to see the changes in the industry of employment and wages. More 2015-2016 community college graduates were employed in the third quarter of 2018 than in the third quarter after graduation. However, as shown in Figure 1, the number employed in retail trade, accommodation & food services, and arts & recreation declined. These decreases were more than offset by increases in health care, manufacturing, education, professional services, finance & insurance, and other industries. This is consistent with information about the economy as a whole from the job to job flows: workers leave jobs in retail and food service to take jobs industries such as manufacturing.
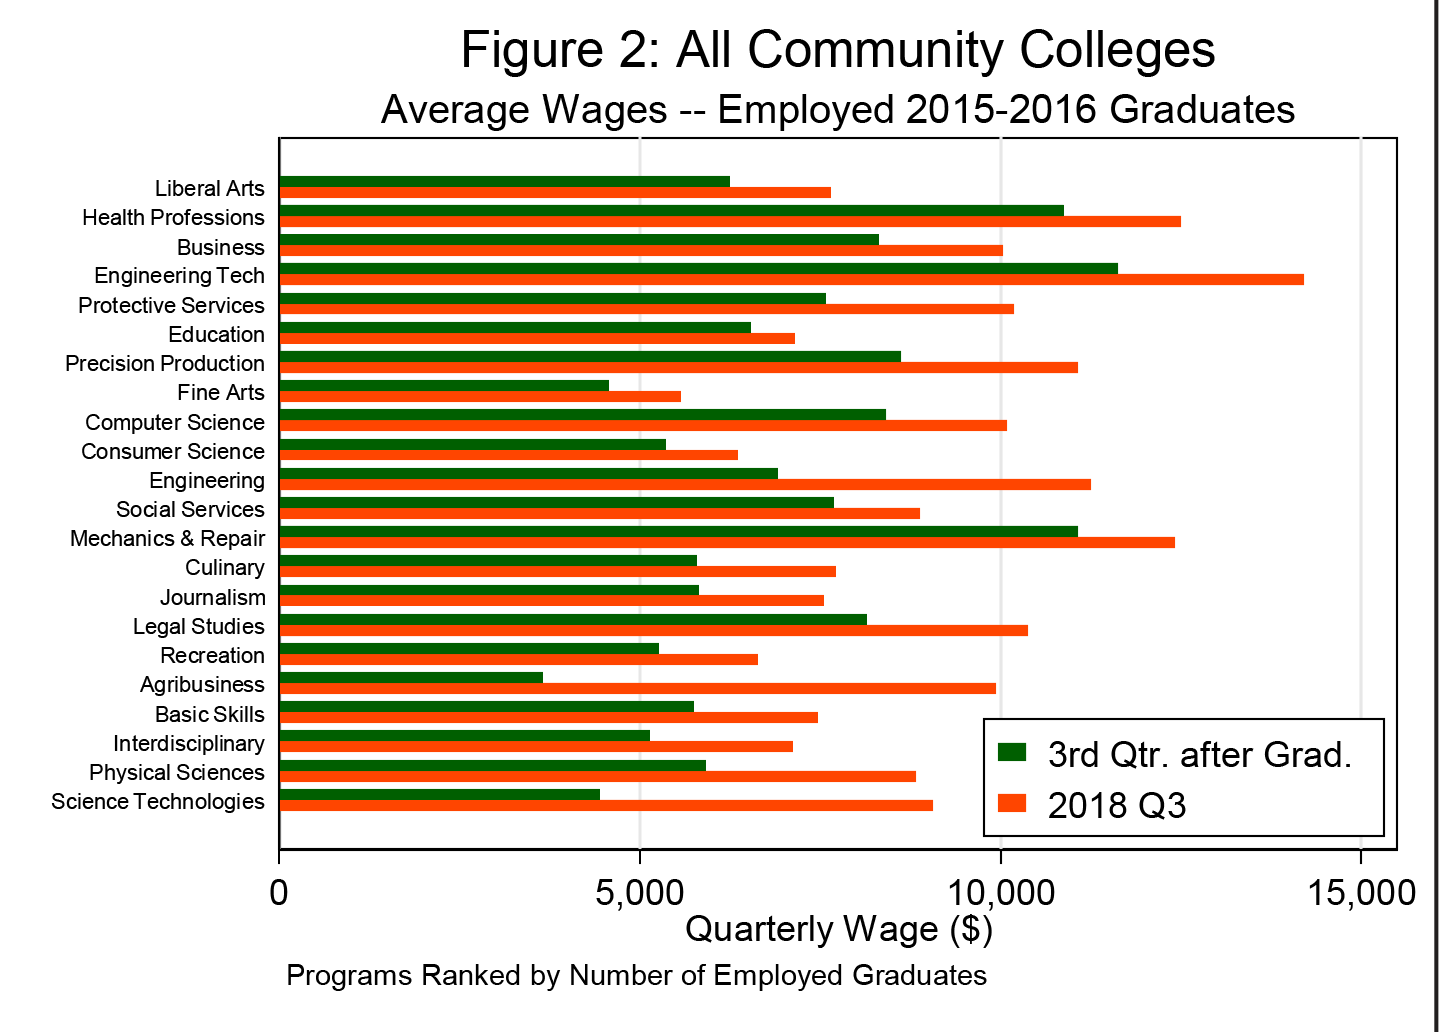
The average quarterly wage earned by employed 2015-2016 community college graduates increased from $7,994 in the third quarter after graduation to $9,626 – a more than 20% increase in what for most graduates is a year and a half. As shown in Figure 2, graduates from every program saw significant increases in wages, with those graduating from the Engineering Technology programs earning the highest average quarterly wage.
In addition to the community colleges, the Higher Education/Workforce Legislative Report Card has employment and wage outcomes from graduates of UConn, the State Universities, and Connecticut residents who graduated from Charter Oak State College. Each of these saw increases in average wages from the third quarter after graduation to the third quarter of 2018 for the 2015-2016 graduates. The report also includes data on the 2016-2017 graduates. Information regarding 2017-2018 graduates will be available in the spring of 2020.
The report shows that a majority of recent graduates of Connecticut’s public colleges and universities are participating in the workforce. While the report does not include information regarding the self-employed, those working out of state, or federal employment, the information about the industry of employment and earnings of recent graduates can help inform program planning by institutions and career planning for current and potential students.
1 The report is available here: https://www1.ctdol.state.ct.us/LRC/LRC2.aspx
2 Information regarding P20-WIN is available here: http://www.ct.edu/p20win


