Examining the composition of Connecticut's employment
by demographics and firm size
By Matthew Krzyzek Office of Research, Department of Labor
 onnecticut employment has been growing since the end of the great recession nearly a decade ago. In recent years, industries such as manufacturing, health care, and warehousing have driven overall growth. In addition, there have been other important trends in Connecticut’s labor market. For example, in the ten year period from 2007 to 2017,
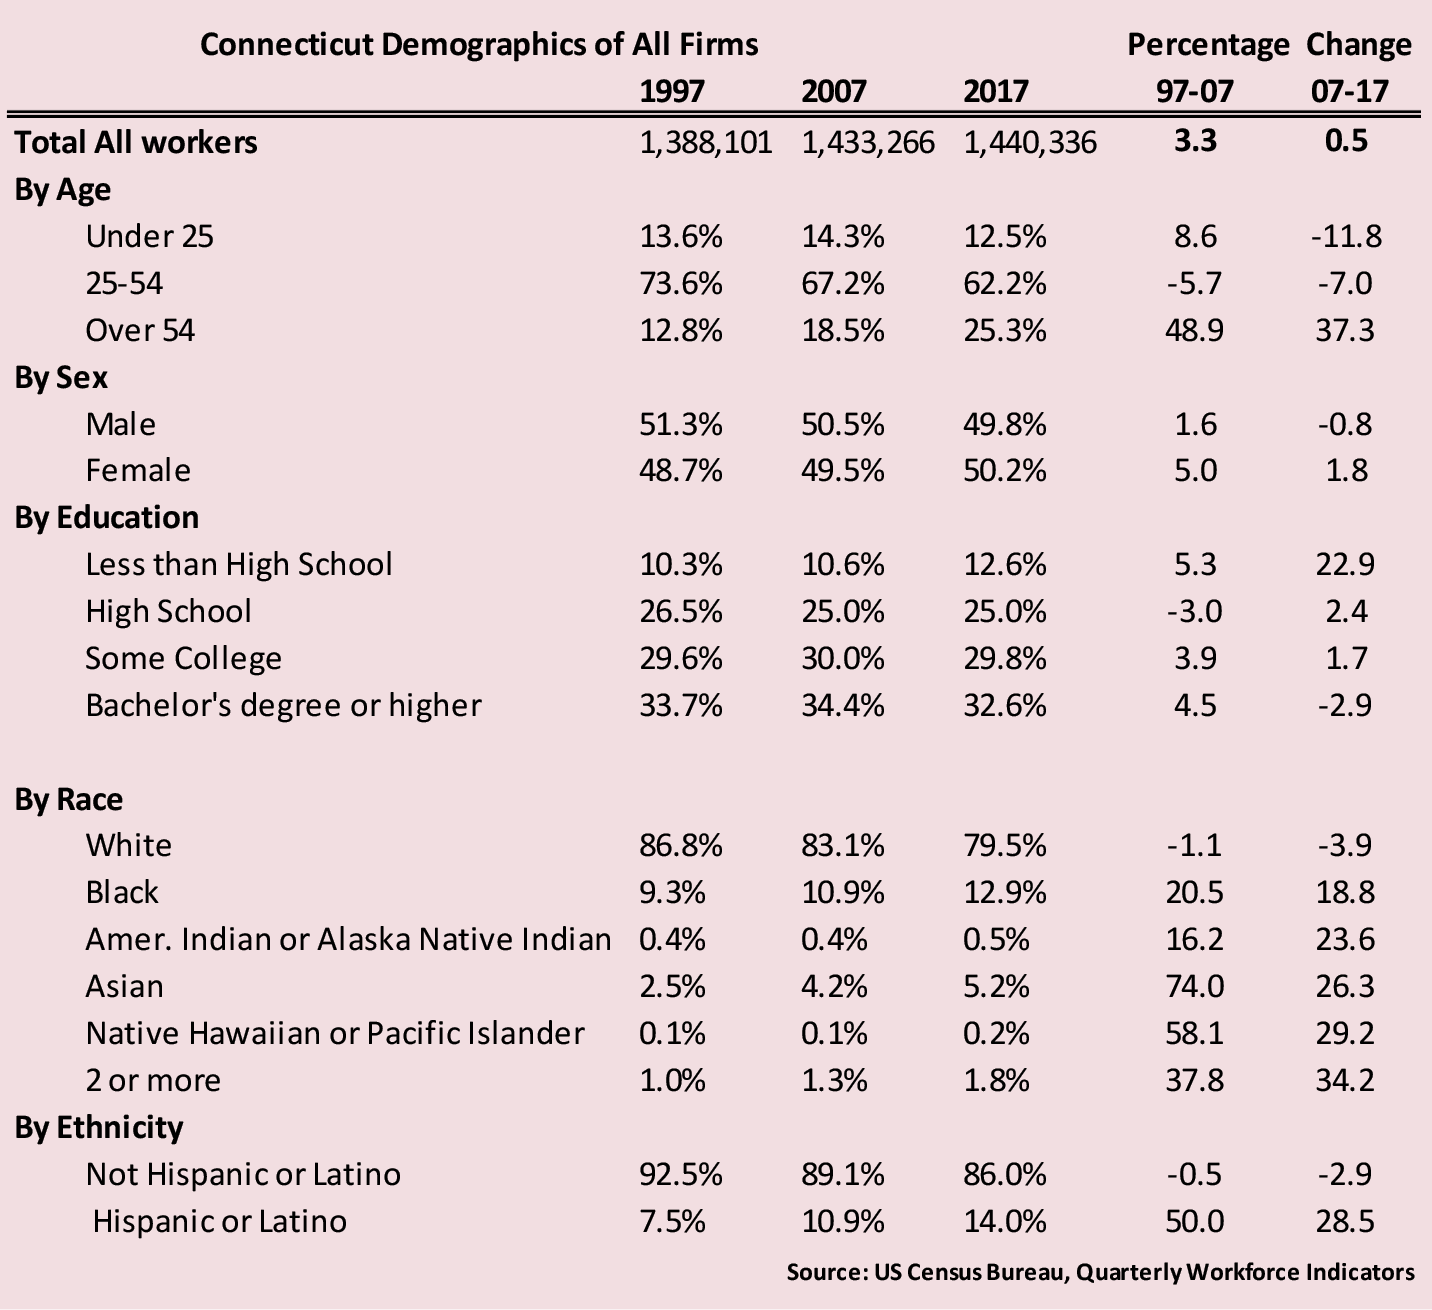
 employment at private firms in Connecticut has gotten older, less male, and less white. At the same time, the share with a Bachelor’s degree or more has fallen. Employment in firms with 500 or more employees has increased while employment at smaller firms has fallen.
DEMOGRAPHICS OF EMPLOYMENT CHANGE
Private sector job growth was quite modest from 2007 to 2017, a period that spanned the great recession. However, the number of workers aged 55 and over increased 37% in that ten year period. The portion aged 55 and over increased from less than 20% to more than 25% of all workers. The number of workers aged 25 to 54 declined as the last of the baby boom aged into the 55 and over group while the number under age 25 declined due to lower birthrates in recent decades and a drop in labor force participation for those aged 16 to 18.
Looking at other demographic factors, in each of the past two decades, the number of males employed has decreased slightly while the number of females increased a bit. By 2017 the number of females employed slightly outnumbered the number of males employed in private sector payroll jobs. At the same time, the number of white and not Hispanic or Latino workers has declined while all other groups have seen increases with Black or African-American employment up 18% and employment of Hispanic or Latino workers up 28% in the ten years from 2007 to 2017.
While nearly two-thirds of those employed in Connecticut have at least some college, the number employed with a Bachelor’s degree or higher decreased from 2007 to 2017 while there has been an increase in the number with less than a high school diploma.
Demographics by Firm Size
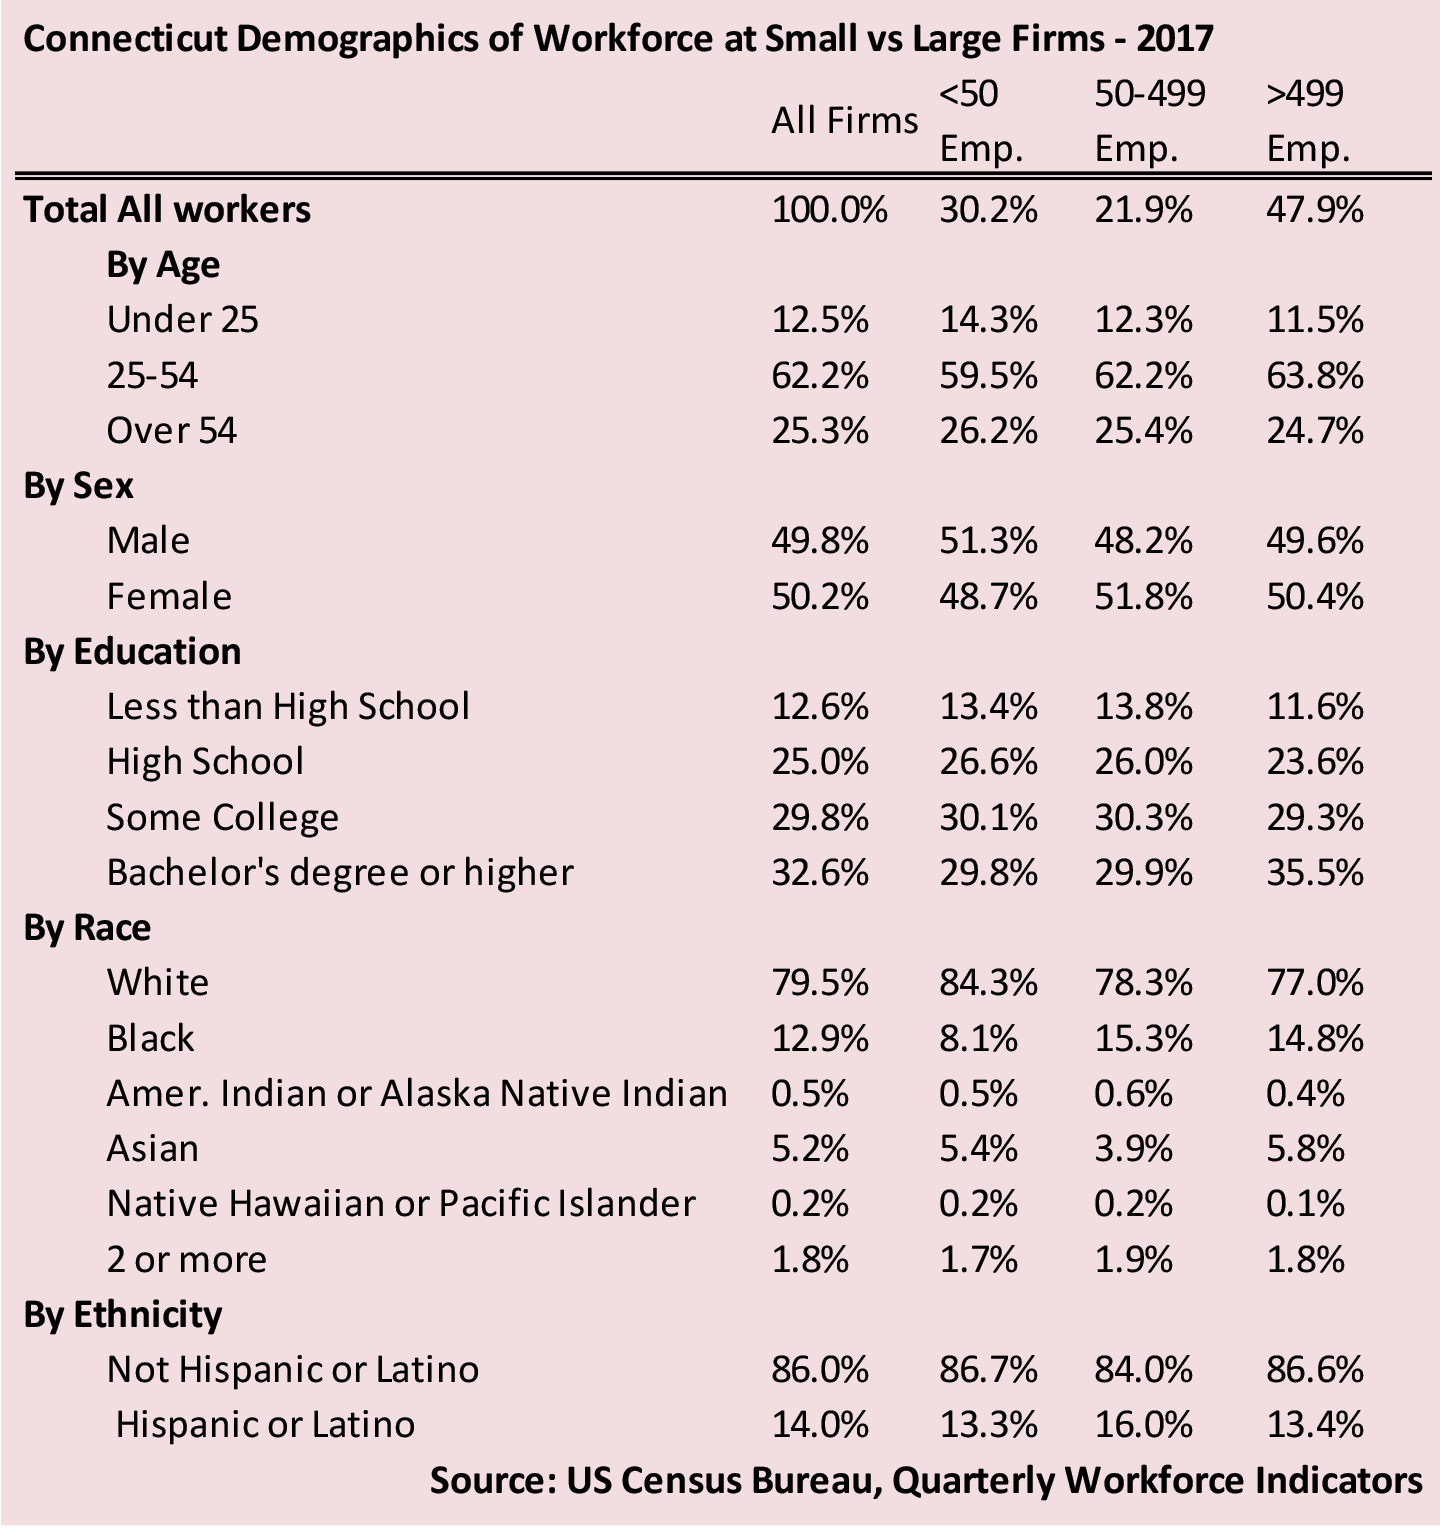
The demographic composition of employment does not vary dramatically based on firm size. However, there are some differences.
When compared to all firms, smaller firms employ proportionally more young, male, and white workers. Smaller firms also are more likely to employ people with lower educational attainment and more workers over 54. In total, 30.2% of private sector employment works at small firms.
Firms with 50-499 employees have an age distribution similar to the average for all firm sizes. These mid-sized firms also employ proportionally more non-white and Hispanic workers than small firms. 21.9% of private sector workers are employed by mid-sized firms.
Large firms, those that employ over 499 workers, employ 47.9% of private sector employment across all industries in Connecticut. They employ proportionally more prime age workers and have the lowest share of younger and older workers when compared to the other firm size groups. Their gender distribution is roughly aligned with the private sector total. Their workforce is more likely to have a Bachelor’s Degree or higher when compared to other firm sizes.
EMPLOYMENT CHANGE BY FIRM SIZE 1997-2017
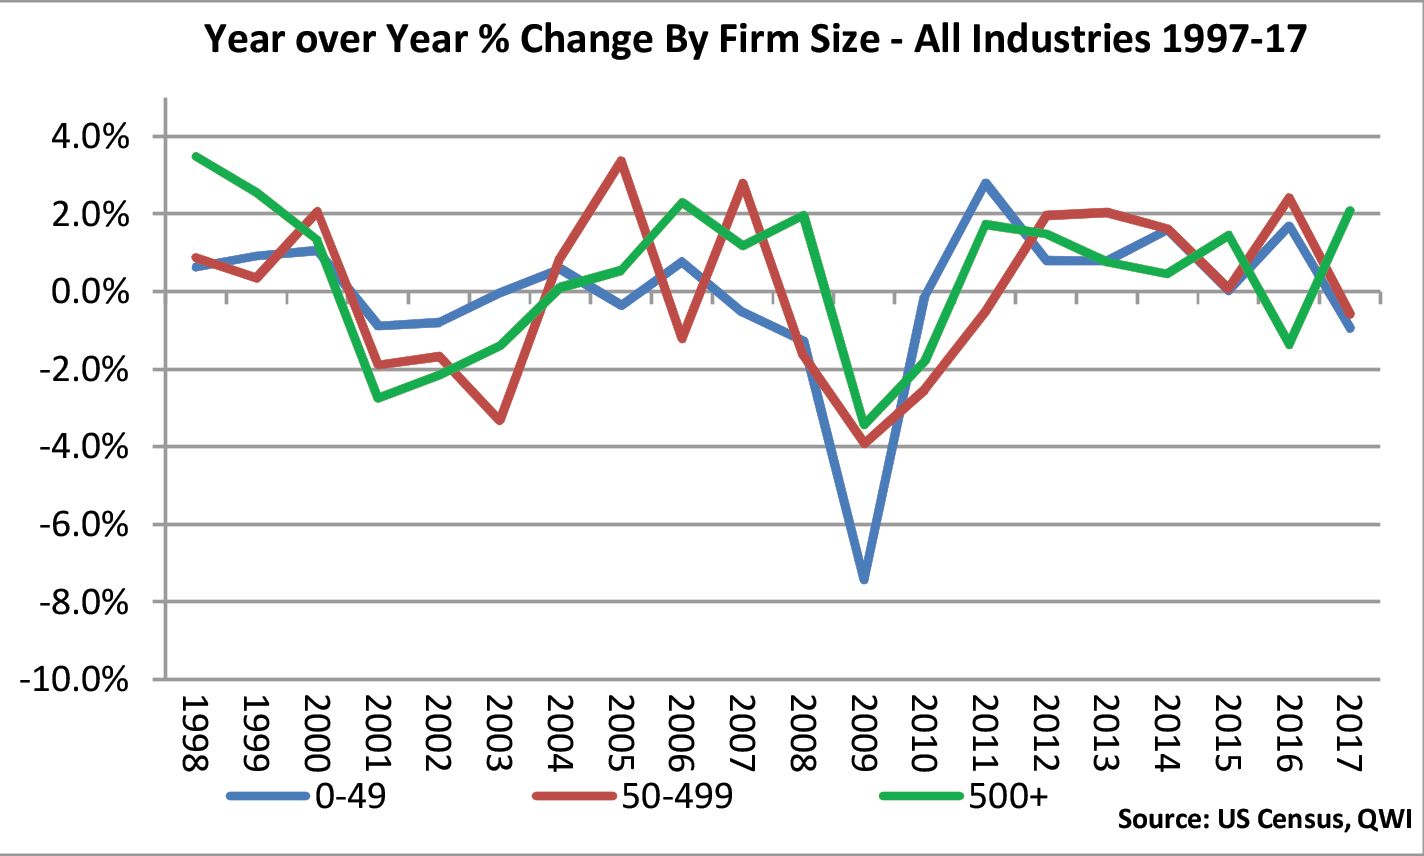
The graph shows year-over-year change in employment by firm size. Small firms begin adding jobs after downturns before medium and large firms. Existing research on cyclicality and firm size has shown that larger firms typically shrink faster during downturns and larger firms expand more slowly after recessions. Large firms also add more jobs than smaller firms later during expansions. The Connecticut data is somewhat consistent with these findings which can be seen in the graph during the 1998-00 and 2006-08 periods. In the late 1990s large firms had large year-over-year employment gains before the 2001 recession; they also shed jobs during the downturn at a larger rate during the recession and began adding jobs more slowly when compared to smaller firm size cohorts. The behavior of firm size cohorts in Connecticut during the 2007-2009 recession shows that smaller firms shed jobs before large firms with steeper losses during the recession, but added jobs sooner, which corresponds with some of the findings of Moscarini and Postel-Vinay (2018).
This data must be used with caution because it doesn’t track specific firms. The numbers are affected when a firm migrates from one cohort to another. For example, if a medium-sized firm grows to become a large firm this will become a drop in employment in medium-sized firms and an increase in employment in large firms.
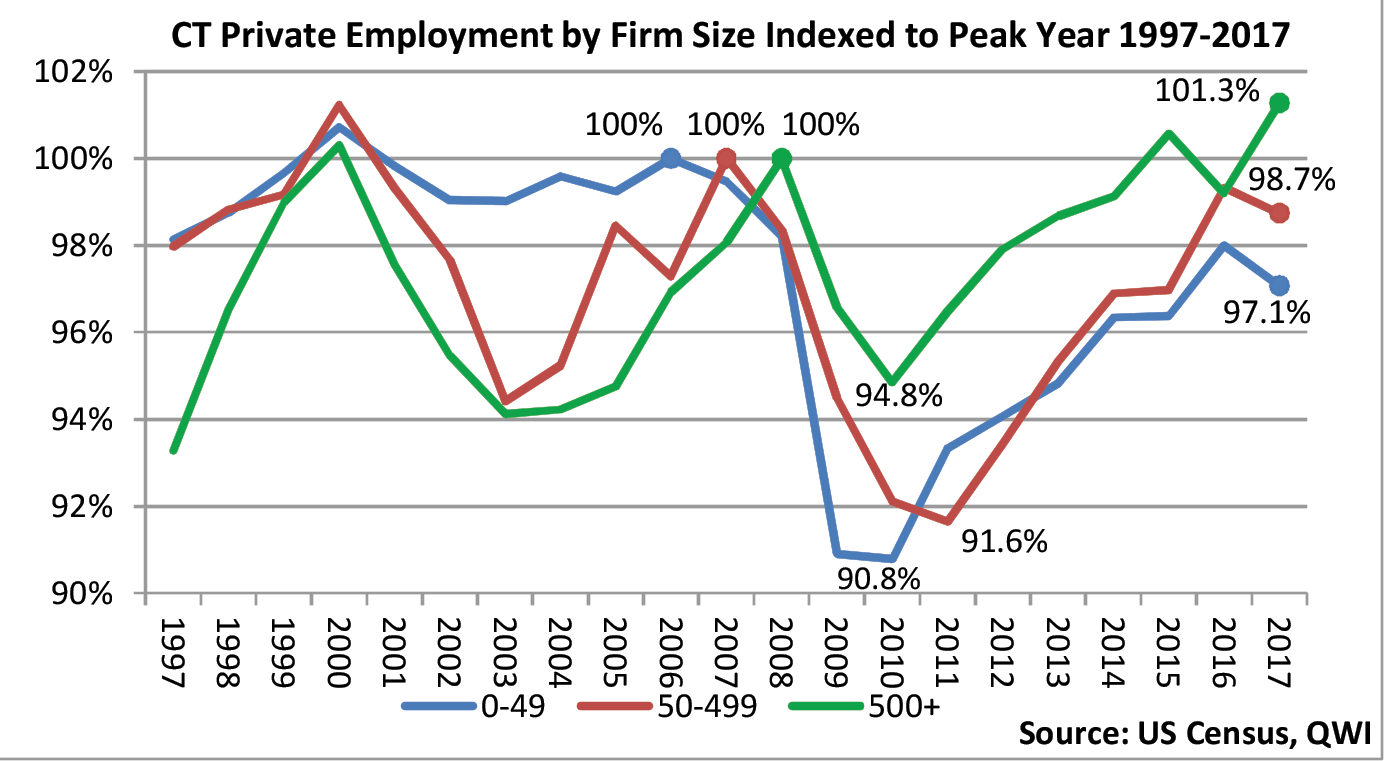
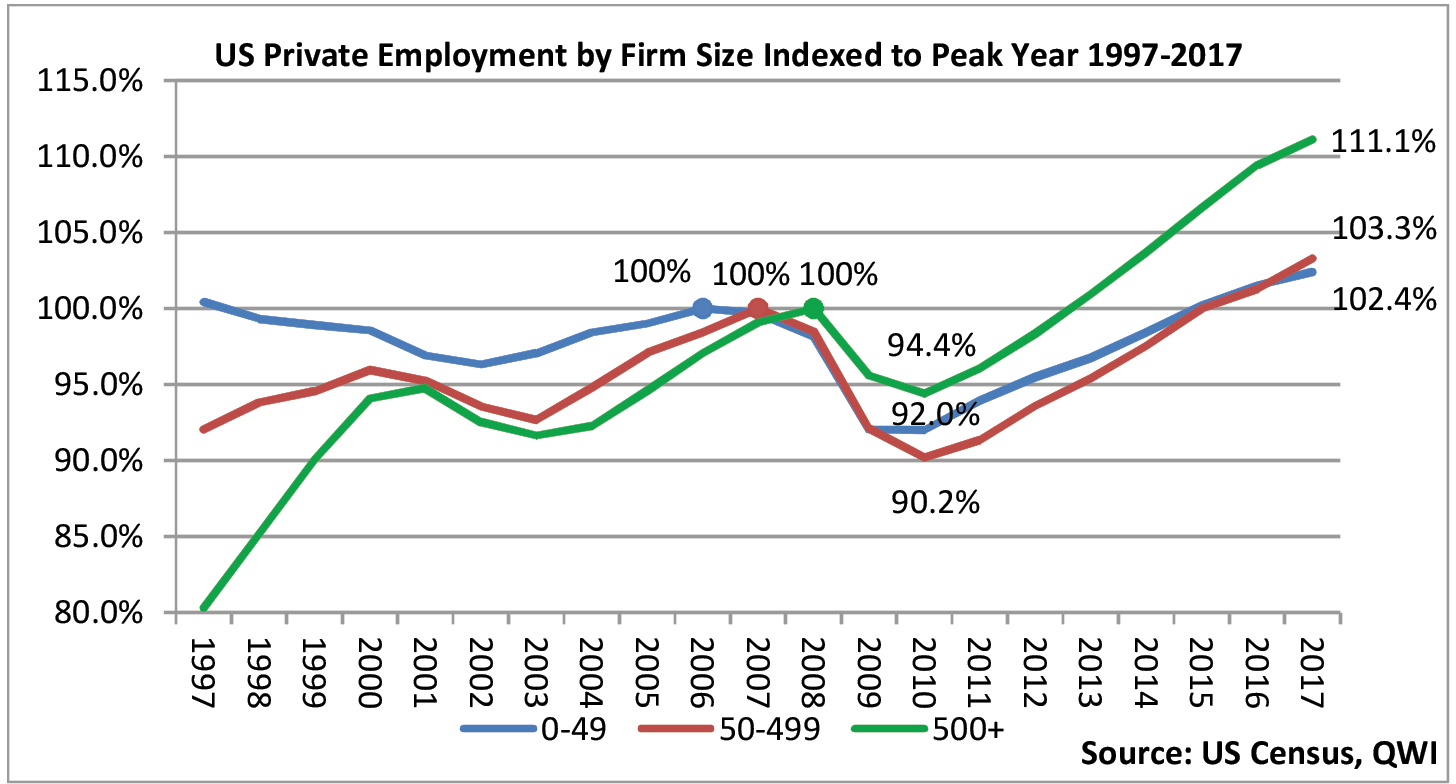
The chart shows total private Connecticut employment by firm size indexed to their respective peak year to illustrate how the distribution of employment has changed. Large firms peaked a year after mid-sized firms and two years after small firms, and were down 5.2 points in 2010. By 2017 employment at large firms was 1.3 percentage points above its 2008 peak.
Employment at medium and small sized firms fell by much more during the recession: down 8.4 and 9.2 percentage points respectively. In 2017 both were below their prerecession total employment levels. This indicates that the distribution of employment in Connecticut in recent years has shifted to larger firms as smaller ones lag in overall job growth. Before 2008, large firms never exceeded 46.6% of total private employment and small firms were 31-32%. By 2017, the share of large and small firms was 47.9% and 30.2% respectively.
Connecticut vs. the U.S.
The U.S. exhibited a similar pattern to Connecticut. Nationally, firms of all sizes continue to add jobs late into the business cycle. Employment at large firms troughed in 2010 and by a similar percent loss to Connecticut large firms. They also surpassed peak levels in 2013, which is when Connecticut large firms started their expansion. Since 2013, large firms have grown faster in the U.S. overall than they have in Connecticut, up 11.1% as of 2017.
Small and medium firms nationwide also declined more than large firms and similarly lagged in employment gains, not reaching expansion until 2015. That year in Connecticut, small and medium firms were between 96 and 97 percent of peak levels.
The rate of business formation in recent years could be one of the variables impacting the lack of employment growth in the state. Nationally, a subset of business formation statistics that includes applications for new businesses likely to have payroll employment peaked in 2006Q1 at 394,000 and hasn’t exceeded 331,000 since late 2008.
 Connecticut peaked at 3,287 in 2006Q2 and hasn’t exceeded 2,561 since 2008Q4. As of the third quarter of 2019, High-Propensity Business Applications for the U.S. and Connecticut are respectively at 82.0 and 75.5 percent of their peak levels.
INDUSTRY COMPOSITION OF FIRM SIZE
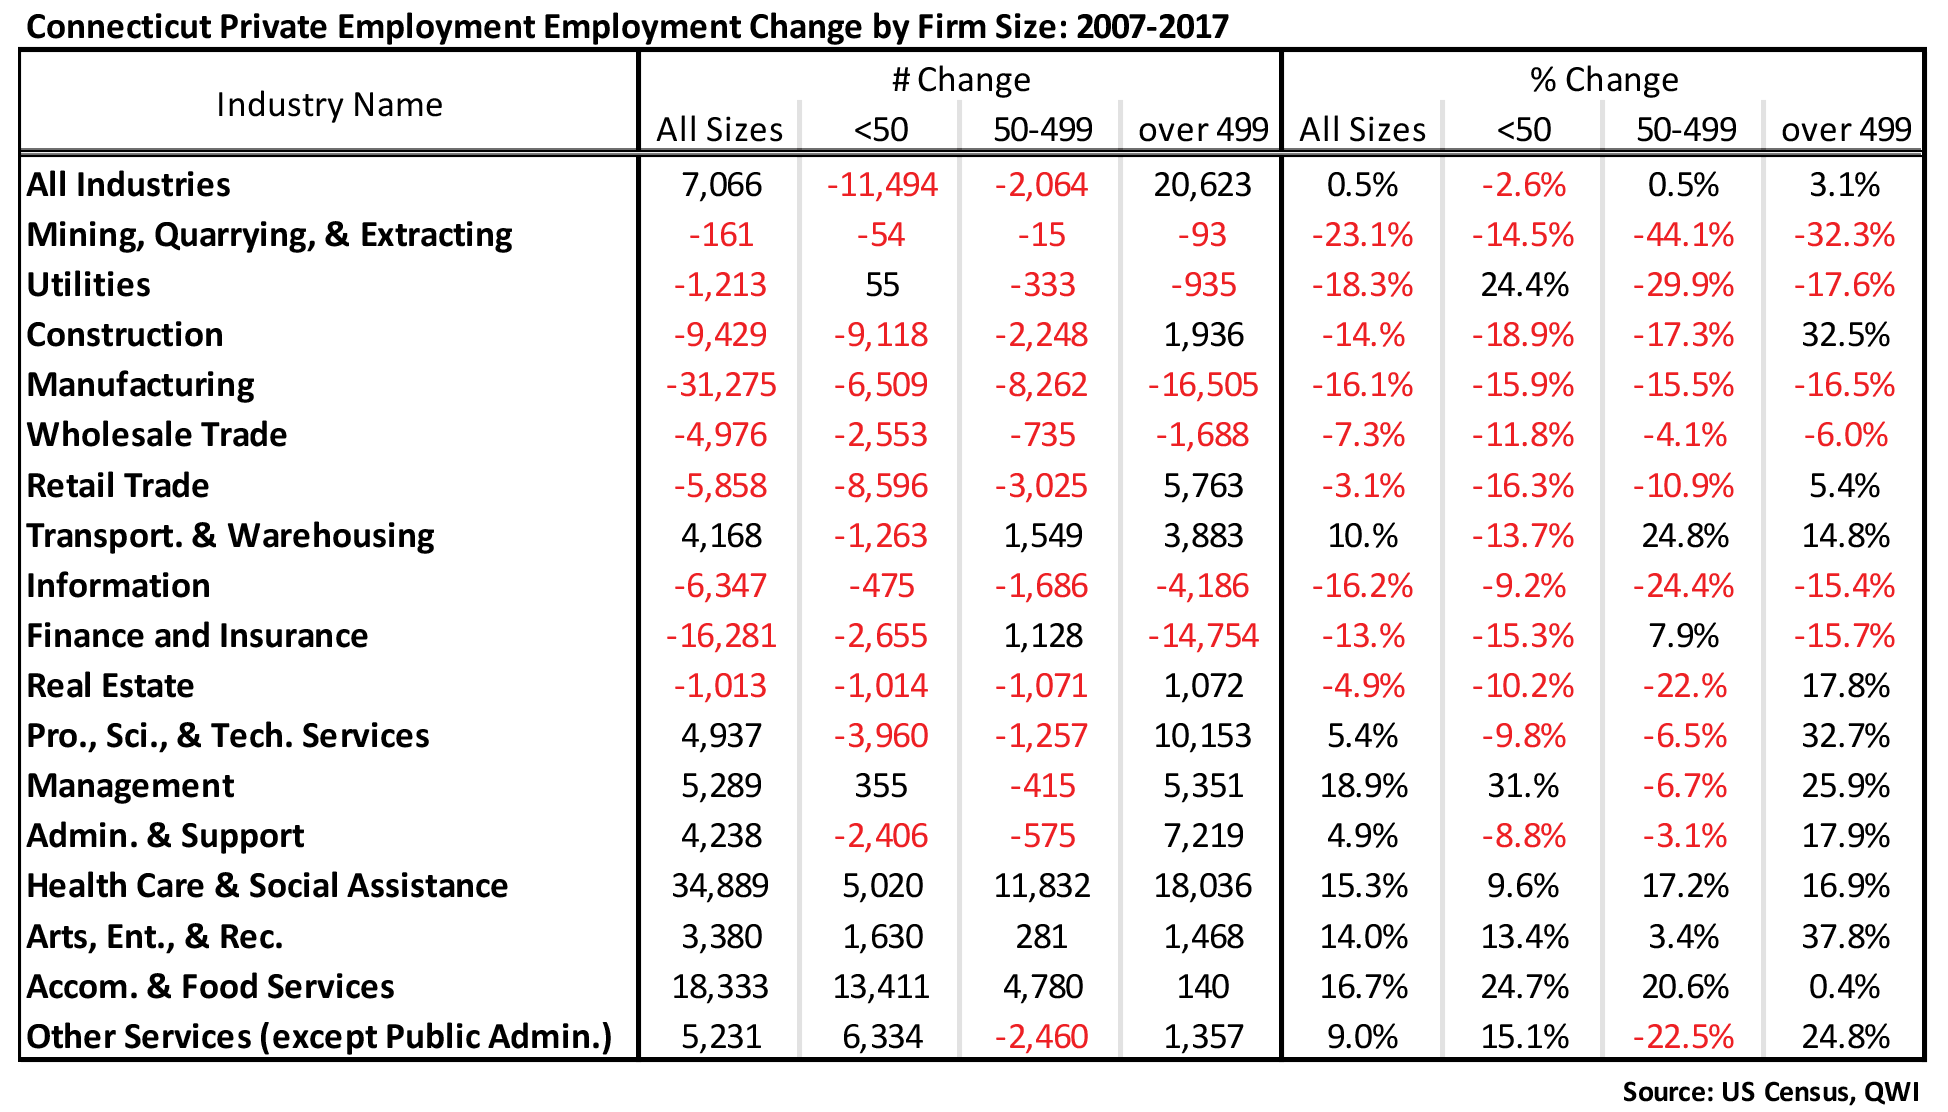
Examination of employment change by size class and industry highlights the dominance of large firms in driving employment growth in most sectors.
Small firm employment since 2007 is down -11,494 or -2.6% overall through 2017 and 11 of 17 sectors have negative growth. The industries with the largest small firm employment declines are Construction (-9,118 or -18.9%), Retail Trade (-8,596 or -16.3%), and Manufacturing (-6,509 or -15.9%). The six industries with small firm industry growth include large gains in Accommodation & Food Services (+13,411 or 24.7%), Other Services (6,334 or 15.1%) and Health Care & Social Assistance (+5,020 or 9.6%).
Medium sized firms had the fewest number of positive change sectors, 5 of 17. Large gains in Health Care (+11,832 or 17.2%) and Transportation & Warehousing (+1,529 or 24.8%) correspond with long term industry growth trends. The former has consistently added jobs overall and the latter began adding jobs in 2010 due to the consumer preference shift to online shopping. Other sectors such as Accommodation & Food Services and Finance & Insurance show percent increases larger than the combined rates for those industries overall. Indeed for Finance & Insurance, the only employment growth was in medium sized firms.
Large firm employment since 2007 is up 20,623 or 3.1% overall through 2017 and 11 of 17 available sectors are above 2007 levels. The industries with the biggest Large firm employment gains are Health Care & Social Assistance (+18,036 or 16.9%), Prof. Sci. & Tech. Services (+10,153 or 32.7%) and Admin. & Support (+7,219 or 17.9%). Major industries with 10 year large firm employment declines include Finance & Insurance (-14,754 or -15.7%) and Manufacturing (-16,505 or -16.5%). Manufacturing has been increasing since 2016 but had not reached its 2007 level by 2017. The large firm decline for Finance & Insurance matches the corresponding rate for small firms and represents a continued trend for that industry overall. Construction, Retail Trade, Real Estate, Professional Scientific & Technical Services, and Administrative & Support Services all showed growth in employment in firms with 500 or more employees and contractions in the other firm size categories in the 2007 to 2017 period.
CONCLUSIONS
Over the ten-year period from 2007 to 2017, Connecticut employment gains have been concentrated in firms with 500 or more employees. The workforce is aging. Employment projections indicate that the demographic shifts highlighted in this article will continue in coming years. Employment growth in Connecticut will require workers to fill new jobs and replace workers who are leaving the workforce due to retirement. This is perhaps the largest challenge facing firms of all sizes. This article used QWI data to illustrate how private sector employment has changed through 2017, the most recent year of data. Other measures of total private employment in Connecticut indicate that the expansion described in this article has continued to add private sector jobs through 2018 and into 2019.
 Much of this article discusses employment by firm size. Firm size data is only available through 2017.
 Moscarini, G., & Postel-Vinay, F. 2018. The Cyclical Job Ladder. Annual Review of Economics, 10, 184-186.
 Boark, Josh (2019, Sept. 5) A slowdown in US business formation poses a risk to economy. Associated Press https://apnews.com/e7179fc8b9dc4399818f2038b75ec423
 U.S. Census Bureau, High-Propensity Business Applications for the United States [HPBUSAPPSAUS] and Connecticut [HPBUSAPPSACT], Federal Reserve Bank of St. Louis FRED;
https://fred.stlouisfed.org/series/HPBUSAPPSAUS and https://fred.stlouisfed.org/series/HPBUSAPPSACT
 |


