Connecticut Projected to Add Jobs Through 2020
By Matthew Krzyzek and Patrick Flaherty, DOL
 onnecticut has many strengths, including its highly-educated workforce, growth of high-paying fields such as manufacturing, a high concentration of world-class universities, and its comparative affordability to high- cost major metropolitan areas in neighboring states. However, job growth has been slower than the nation as a whole, and slower than in our neighbor states. Connecticut is projected to continue to add jobs over the next two years with many of the trends observed over the past two years continuing through 2020.
Connecticut’s overall economy improved in 2018 (see the March 2019 Digest) with the eighth consecutive year of employment growth. Even though the past two years had the slowest growth since the end of the recession, Connecticut’s unemployment rate fell to its lowest level since 2002, while the employment to population ratio hit a ten year high with the labor force participation rate at its highest level in eight years.
The unemployment rate is low despite slow job growth because our working-age population has also increased at a slower pace – up 5.2% over ten years compared to a 9.9% increase nationally. To put it simply, our slower population growth is resulting in slower employment growth.
Each year, the Connecticut Department of Labor produces short term projections by industry and occupation. The most recent projections are for the two-year period 2018Q2 through 2020Q2. During the previous two-year period (2016Q2 to 2018Q2), Connecticut’s overall employment grew by 6,350 jobs, or 0.4%. The private sector increased 12,537 (0.9%), while the government sector declined 6,187 (-2.6%).
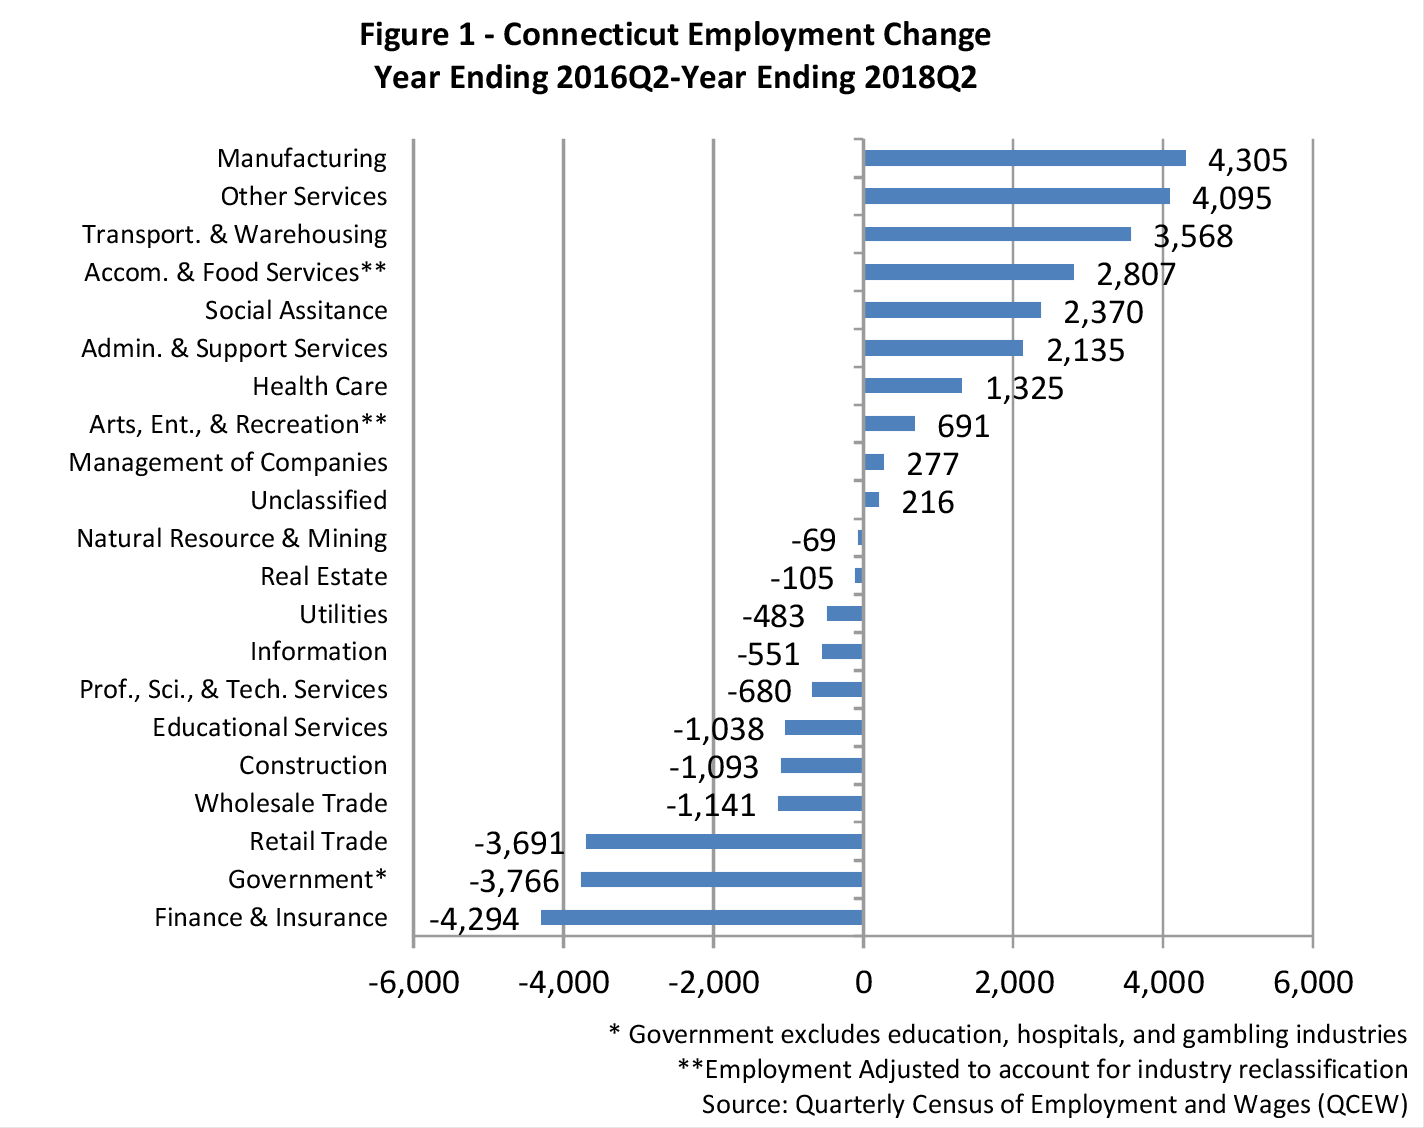
The three sectors with the largest two-year gains were Manufacturing, Other Services, and Transportation and Warehousing, which increased by 4,305, 4,095, and 3,568 jobs, respectively, from 2016 to 2018 (Figure 1). The gains in Manufacturing and Transportation and Warehousing represent recent shifts in the Connecticut economy.
Manufacturing continues to add jobs in the state, a turnaround that began in the first quarter of 2016. This growth is unique in the area. Our 2.8% growth from 2016-2018 compares favorably to the neighboring states of Massachusetts and New York, which were down 0.7% and 1.5%. Connecticut’s two-year Manufacturing growth outpaces the national average of 2.6% and is driven by strong gains in transportation equipment manufacturing. Announcements from major employers suggest that growth in this sector will continue for the foreseeable future.
Transportation and Warehousing growth is due primarily to the increased number of internet retailer warehousing distribution centers in the state, which began adding Connecticut locations in late 2015.
Increased on-line shopping has led to employment increases in the Transportation and Warehousing sector, but to declines in Retail Trade, which was down 3,691 in the two years preceding the 2018Q2 projection base. Despite these declines, Retail Trade remains one of the largest sectors – it averaged 180,000 jobs in 2018Q2.
Finance and Insurance employment fell by 4,000 jobs during the two years ending 2018Q2, as banks and investment firms contracted. The insurance industry added nearly 800 jobs in this period.
Most of the decline in government employment was at the state level. Education and health each declined about 1,000 jobs, while public administration fell by over 2,000. Local government also contracted.
Other industries of note include Accommodations and Food Services, which continues to add jobs at a faster rate than the overall economy and construction which was down over 1,000 jobs from 2016Q2 to 2018Q2, mostly due to a sluggish second quarter last year but which has since added jobs. As of March 2019 construction was up 2,500 jobs from the previous year.
Health Care and Social Assistance, the largest combined sector of the economy, continues to add jobs overall, driven by strong gains in Ambulatory Health Care and Social Assistance, up 4.9% and 3.8%, respectively, in the two years ending 2018Q2. These gains were tempered by losses in other components of the sector with Hospitals, down 1.5%, and Nursing and Residential Care Facilities, down 3.2%. Those two industries had respective employment peaks in 2012 and 2014.
CONNECTICUT SHORT-TERM PROJECTIONS
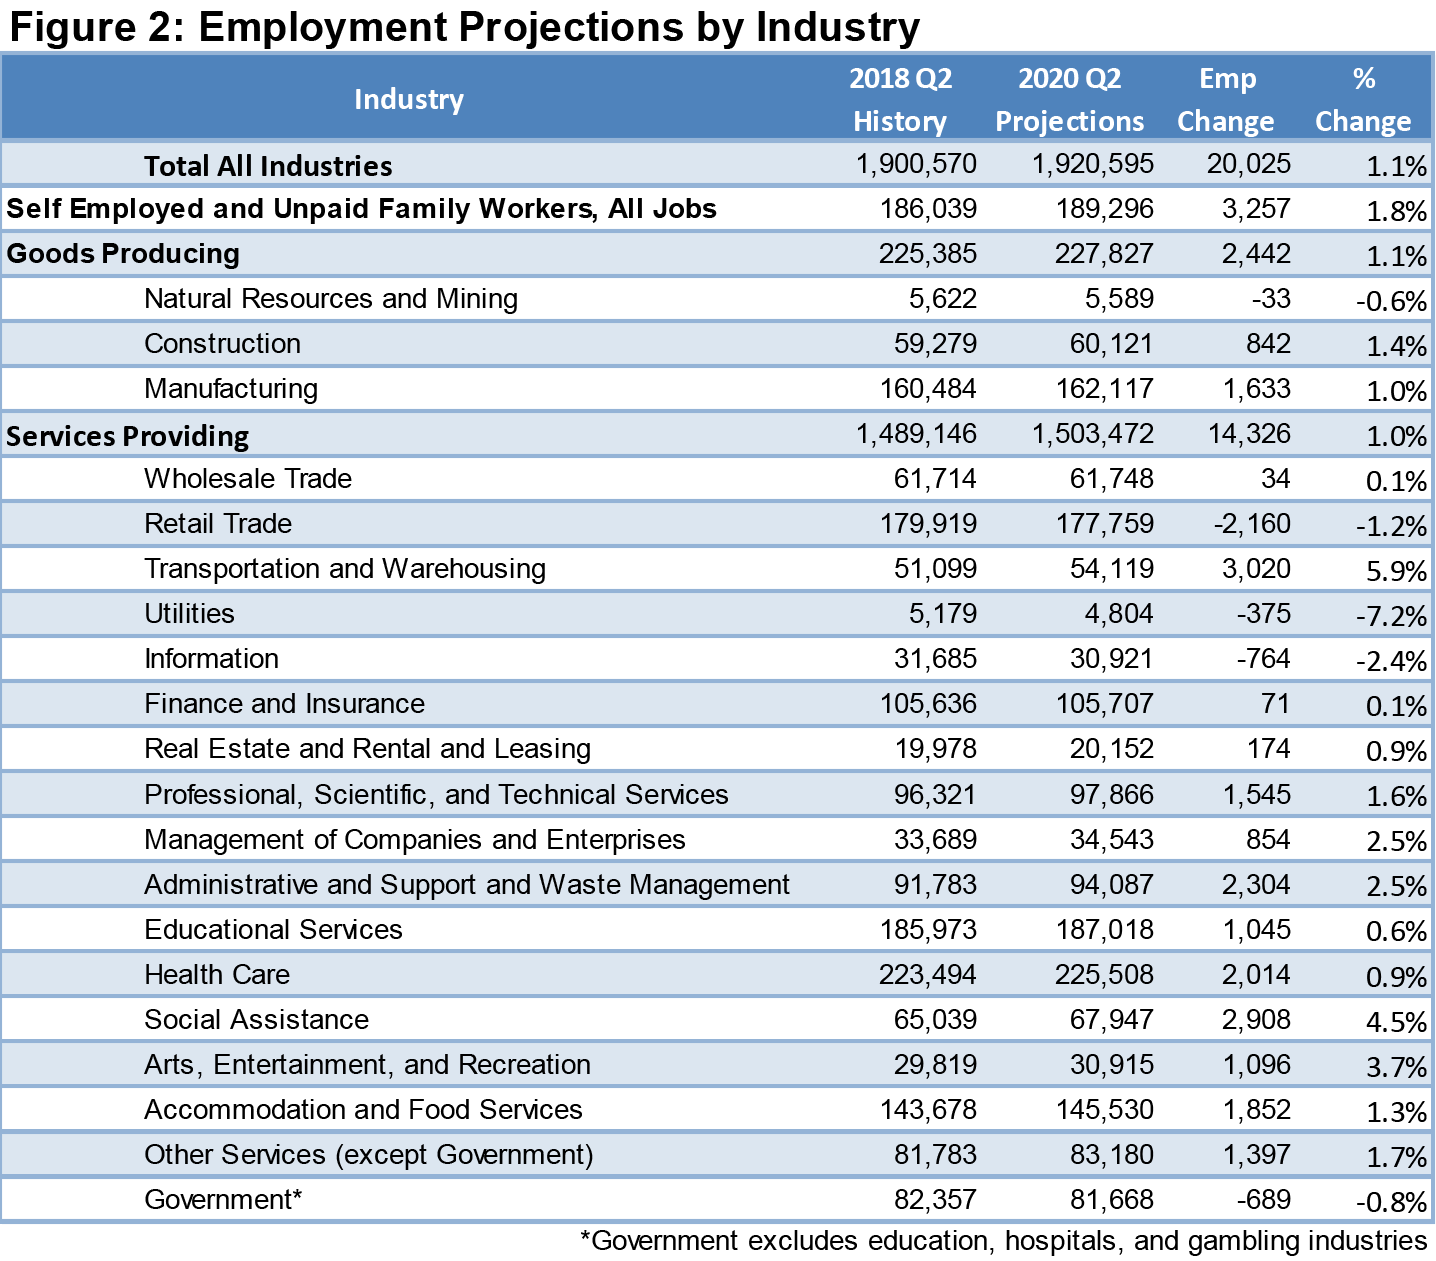
Connecticut’s overall employment is projected to increase 1.1% from 2018Q2 to 2020Q2 (Figure 2). During this period we project overall employment in Connecticut to increase from 1,900,570 to 1,920,595. This rate increase matches the rate from last year’s short term projection.
Projections by Industry
The industries that are projected to add the most jobs through 2020 are Transportation and Warehousing, Social Assistance, Administrative and Support Services, and Health Care. Transportation and Warehousing sector growth is driven by consumer demand shifts to online shopping. Warehouse distribution centers have been built throughout the state in recent years and 83% of projected gains are in the Warehousing component of that sector. Strong social assistance growth is due to demographic aging in the state, as 80% of that sector growth is in Individual and Family Services, which provides services to the elderly and other groups. Growth in Administrative and Support Services is due to an increase in services to buildings and dwellings such as janitorial, landscaping, and cleaning services. The same demographic trends increasing demand for social assistance are also increasing demand for health care, although there is a shift in that industry away from large institutions toward ambulatory, outpatient, and home care.
Other growing sectors include Manufacturing which is expected to add over 1,600 jobs in the two year period. While growth in manufacturing is a huge turnaround after decades of decline, this projection may prove to be pessimistic as Connecticut has seen an increase of 1,700 manufacturing jobs in one year alone (year ending March 2019).
Professional, Scientific, and Technical Services are projected to grow on the strength of Computer Systems Design and Related Services. This industry includes a wide range of Information Technology (I.T.) businesses.
While not a specific “industry” the number of self-employed workers is expected to increase by 3,257 over the two-year period, just slightly faster than payroll employment jobs.
Major sectors that show decreases include Utilities, Government, Information, and Retail Trade with projected declines of 375, 689, 764, and 2,160, respectively. The Utilities sector has shed employment since at least the early 1990s, down roughly 50% over that 28-year period through 2018. The projected declines in the Information sector are driven by Newspapers, a component industry that has gradually contracted since 2000. Government is projected to decline at the federal, state and local levels. While we know the U.S. Census will be in full swing in the 2018Q2 with a large number of (temporary) federal jobs, they are not included in these projections. The Retail Trade downturn that began in the fourth quarter of 2016 has continued through 2018, driven by aforementioned shifts in consumer preferences, and is projected to continue into 2020. The decline of more than 2,000 jobs over a two-year period will still leave Retail as one of the largest sectors.
Projections by Occupation
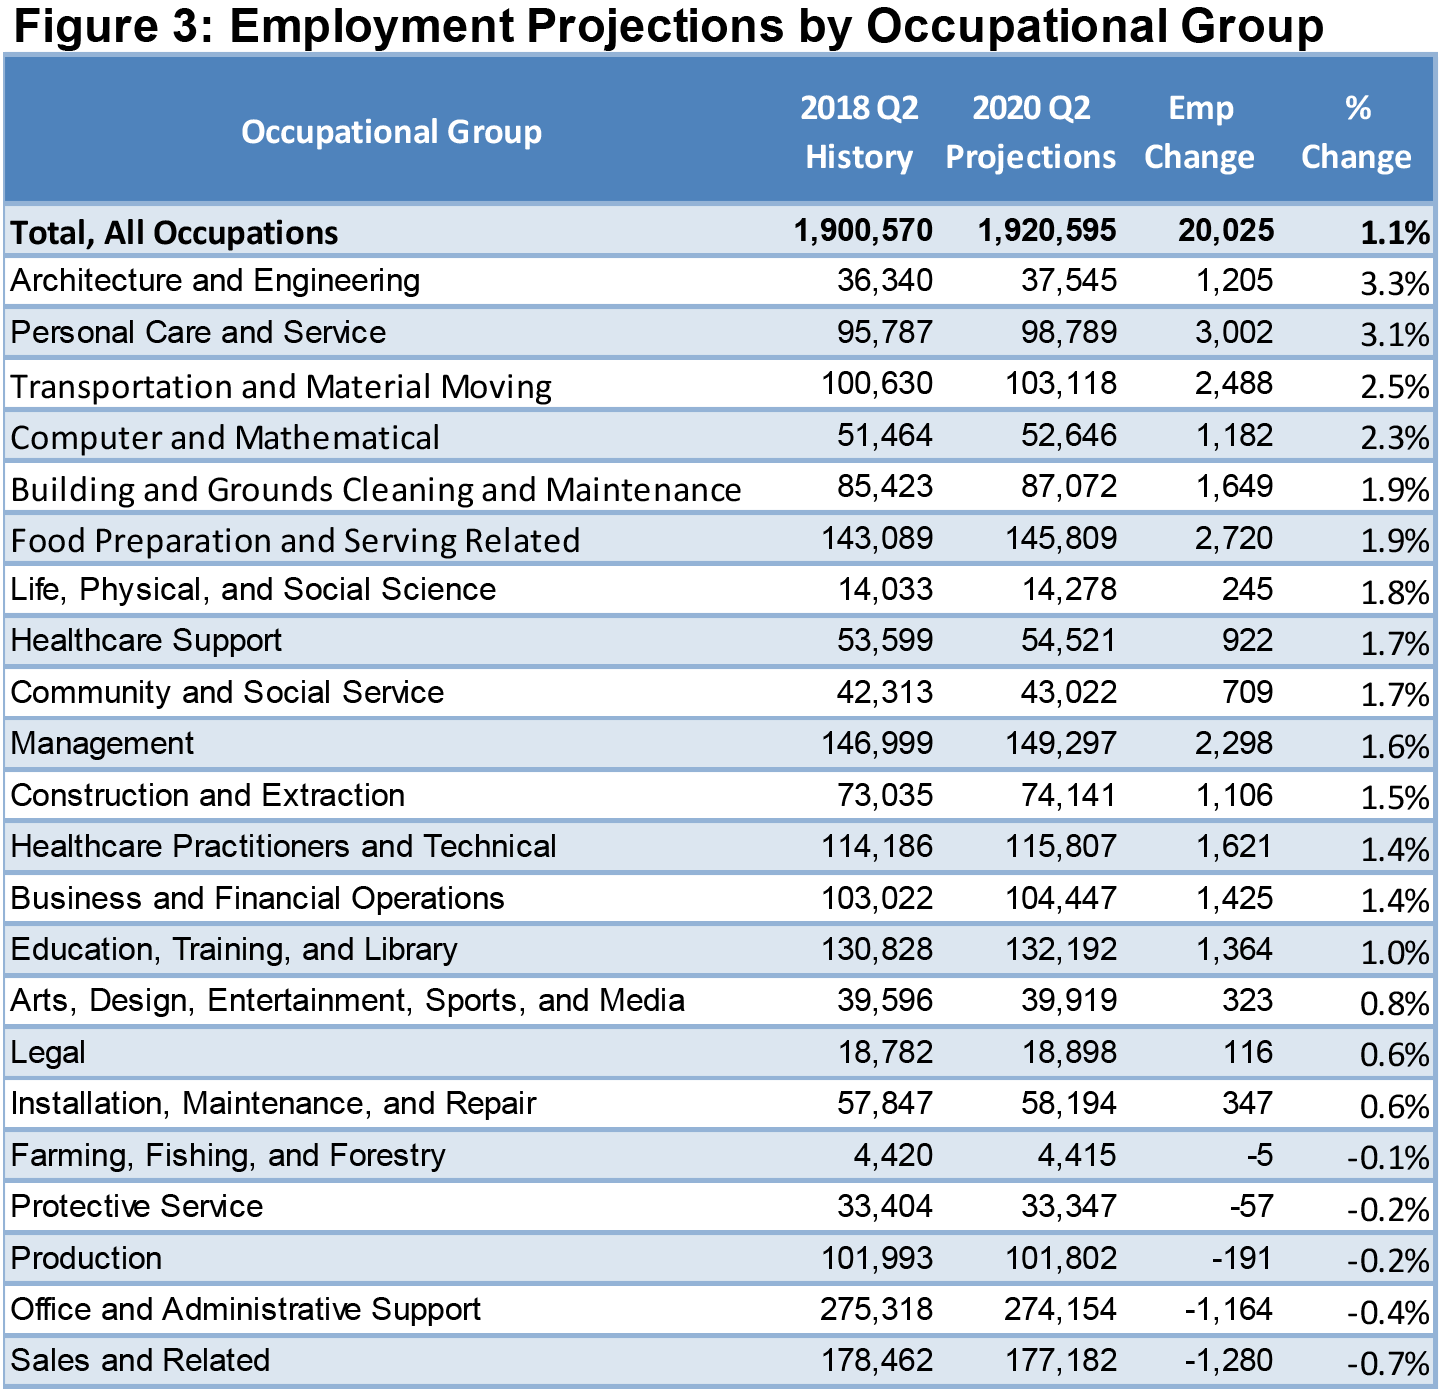
As is noted above, the 1.1 percent projected growth for the overall economy corresponds to an employment increase of 20,025 during the two-year period ending on 2020 Q2. The occupational groups expected to increase the most are Personal Care and Service Occupations, up 3,002 jobs, Food Preparation and Serving Related, up 2,720 jobs, Transportation and Materials Moving Occupations, up 2,488 jobs, and Management Occupations, up 2,298 jobs (Figure 3). The top three occupational groups were also the top groups for the 2017-2019 projections.
Two major occupational groups with projected declines over the two-year period are Sales and Related, down 1,280, and Office and Administrative Support, down 1,164 jobs. The changes in occupational employment are driven by the industry changes discussed in the previous section. For example, the strong growth in Personal Care and Service Occupations is driven by Social Assistance Industry growth.
Connecticut’s Projections Compared to Other States
Looking at other states in our region, Personal Care and Service occupations are also expected to add the most jobs in Massachusetts and Vermont. However, New Hampshire and Rhode Island are expected to see the most jobs added in Food Preparation and Serving occupations. Maine is expected to add the most jobs in Office and Administrative Support occupations, an occupational group where Connecticut is projected to see declines. New York is expected to see an astonishing 11.1% growth in Health Care Support occupations – 46,300 additional jobs in just two years. This includes a projected increase of 39,630 home health aides, nearly 9% growth per year in this occupation.
Connecticut's projected 2018-2020 job growth of 1.1% is similar to many states in the Northeast and the Midwest.
The South and West regions of the country are projected to grow by 3.2% and 3.6%, respectively, through 2020, while the Midwest and Northeast have increases of 1.6% and 2.0%, respectively. Closer to home, New England's combined projected growth rate of 1.9% is driven by the 2.7% expected growth in Massachusetts, a state that accounts for 48% of overall New England employment. The remaining New England states are all projected to increase by between 1.3% (Rhode Island) and 0.6% (Maine).
The state with the fastest projected growth is Arizona (+5.5%), with Delaware the slowest (+0.5%). There are 18 states with projected growth between 0.4% faster or 0.4% slower than Connecticut (a difference of 0.2% faster or slower per year). States with similar growth rates include Midwest states, such as Wisconsin, Illinois, Minnesota, Kansas, and Iowa.
Occupational Projections by Wage
In 2018, the median wage in Connecticut for all occupations was $46,900. All wages are adjusted for full-time/full-year work. Growth is projected in occupations with a wide range of wages with 31% of growth in occupations with a median wage less than $30,000 per year, such as personal care aides and food prep & serving workers. Occupations with wages between $30,000 and $60,000, including Warehouse and Landscaping Workers, Medical Assistants, and Tractor-Trailer Truck Drivers, will make up 27% of the two-year projected increase. Registered Nurses, Mechanical Engineers, and Accountants & Auditors will have the largest increases among occupations with median wages between $60,000 and $90,000 per year (17% of total job growth will be in occupations in this category). Occupations with median wages between $90,000 and $120,000 will make up 16% of job growth, with the largest increases in software developers, management analysts, and aerospace engineers. Finally, there will be an increase of 1,848 (just under 10% of the total increase) in jobs with a median wage above $120,000, including financial managers, computer and information systems managers, lawyers, and dentists.
There are over 700 occupations in the economy, and this article has touched on those expected to show the greatest increases over the next two years. There will be openings in virtually every occupation – even those that are contracting – as workers retire or move on to other jobs and need to be replaced. Detailed information about every occupation in the Connecticut economy, including projections, wages, and required skills, is available on the Connecticut Department of Labor Office of Research website.
Conclusion
Connecticut’s short-term projections show that the growth experienced in the recent past is expected to continue through 2020. Trends that started or persisted in recent years, such as growth in Manufacturing, Social Assistance, and Transportation and Warehousing, are likely to continue. Overall labor market measures, such as a low unemployment rate and high employment to population ratio, suggest that demographics and slow population growth are the largest challenges Connecticut faces as it attempts to accelerate job growth.
These projections were produced with the best available information as of February 2019. There are upside and downside risks to these projections. The national business cycle is currently breaking records with the longest string of positive monthly job changes ever recorded, and these projections were produced under the assumption that this will continue. However, there are a few signs that the national economy may be slowing. A national recession would harm Connecticut.
On the other hand, the recent growth in manufacturing has been significantly faster than we projected a few years ago. That sector, which had seemed to be in perpetual decline, has been adding jobs faster than expected. Other industries may surprise us in the coming years.
Data Limitations: The projections in this report have been carefully prepared to ensure accuracy, but by nature are subject to error. For more detail on the short-term occupational projections, visit: www.projectionscentral.com/Projections/ShortTerm


