Connecticut's 2017 Work-Related Fatalities - Below Annual Average
By Erin C. Wilkins, Associate Research Analyst, Department of Labor
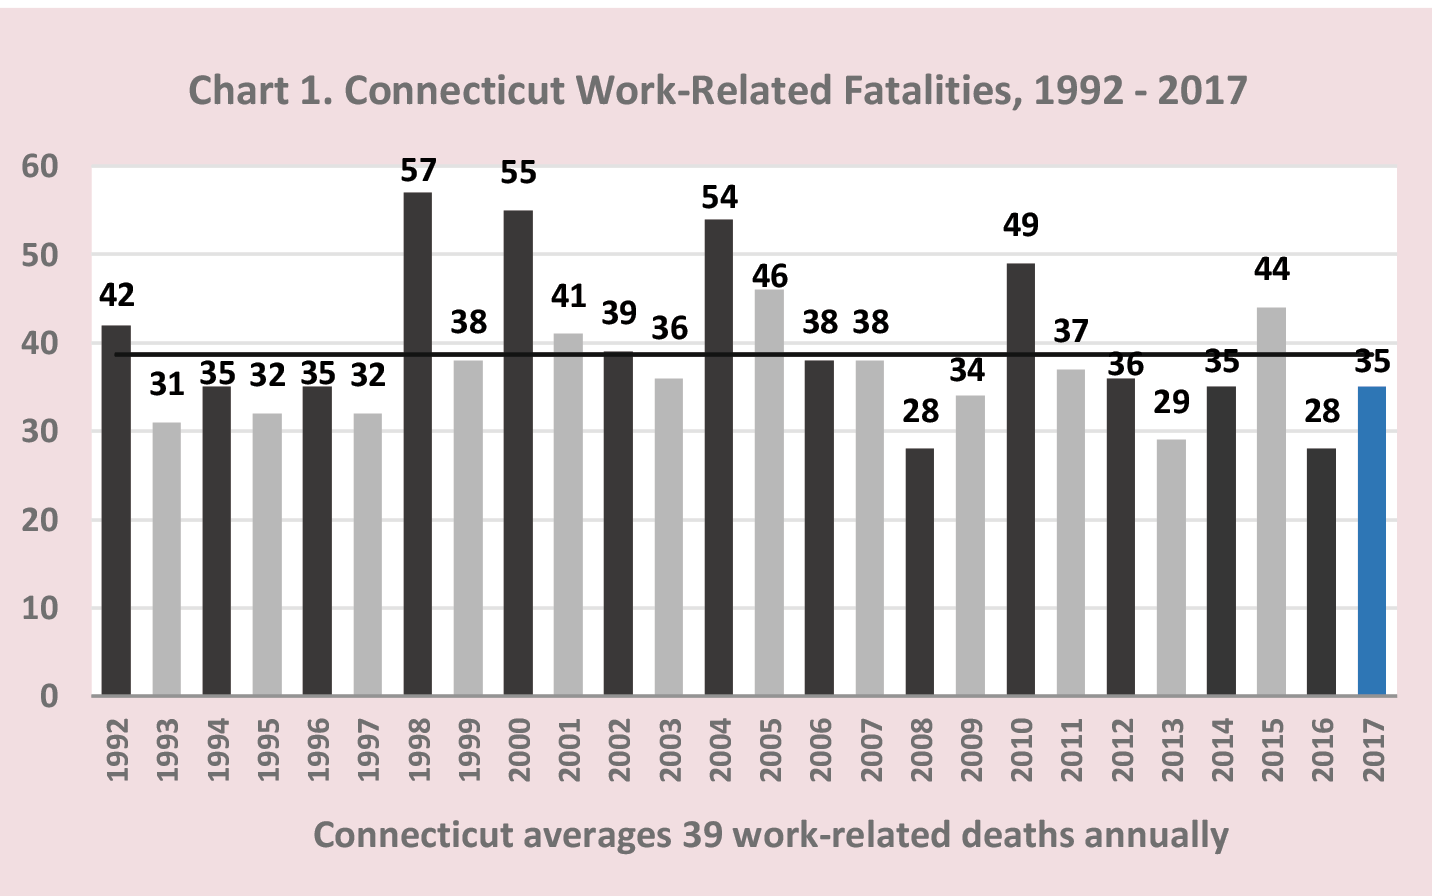
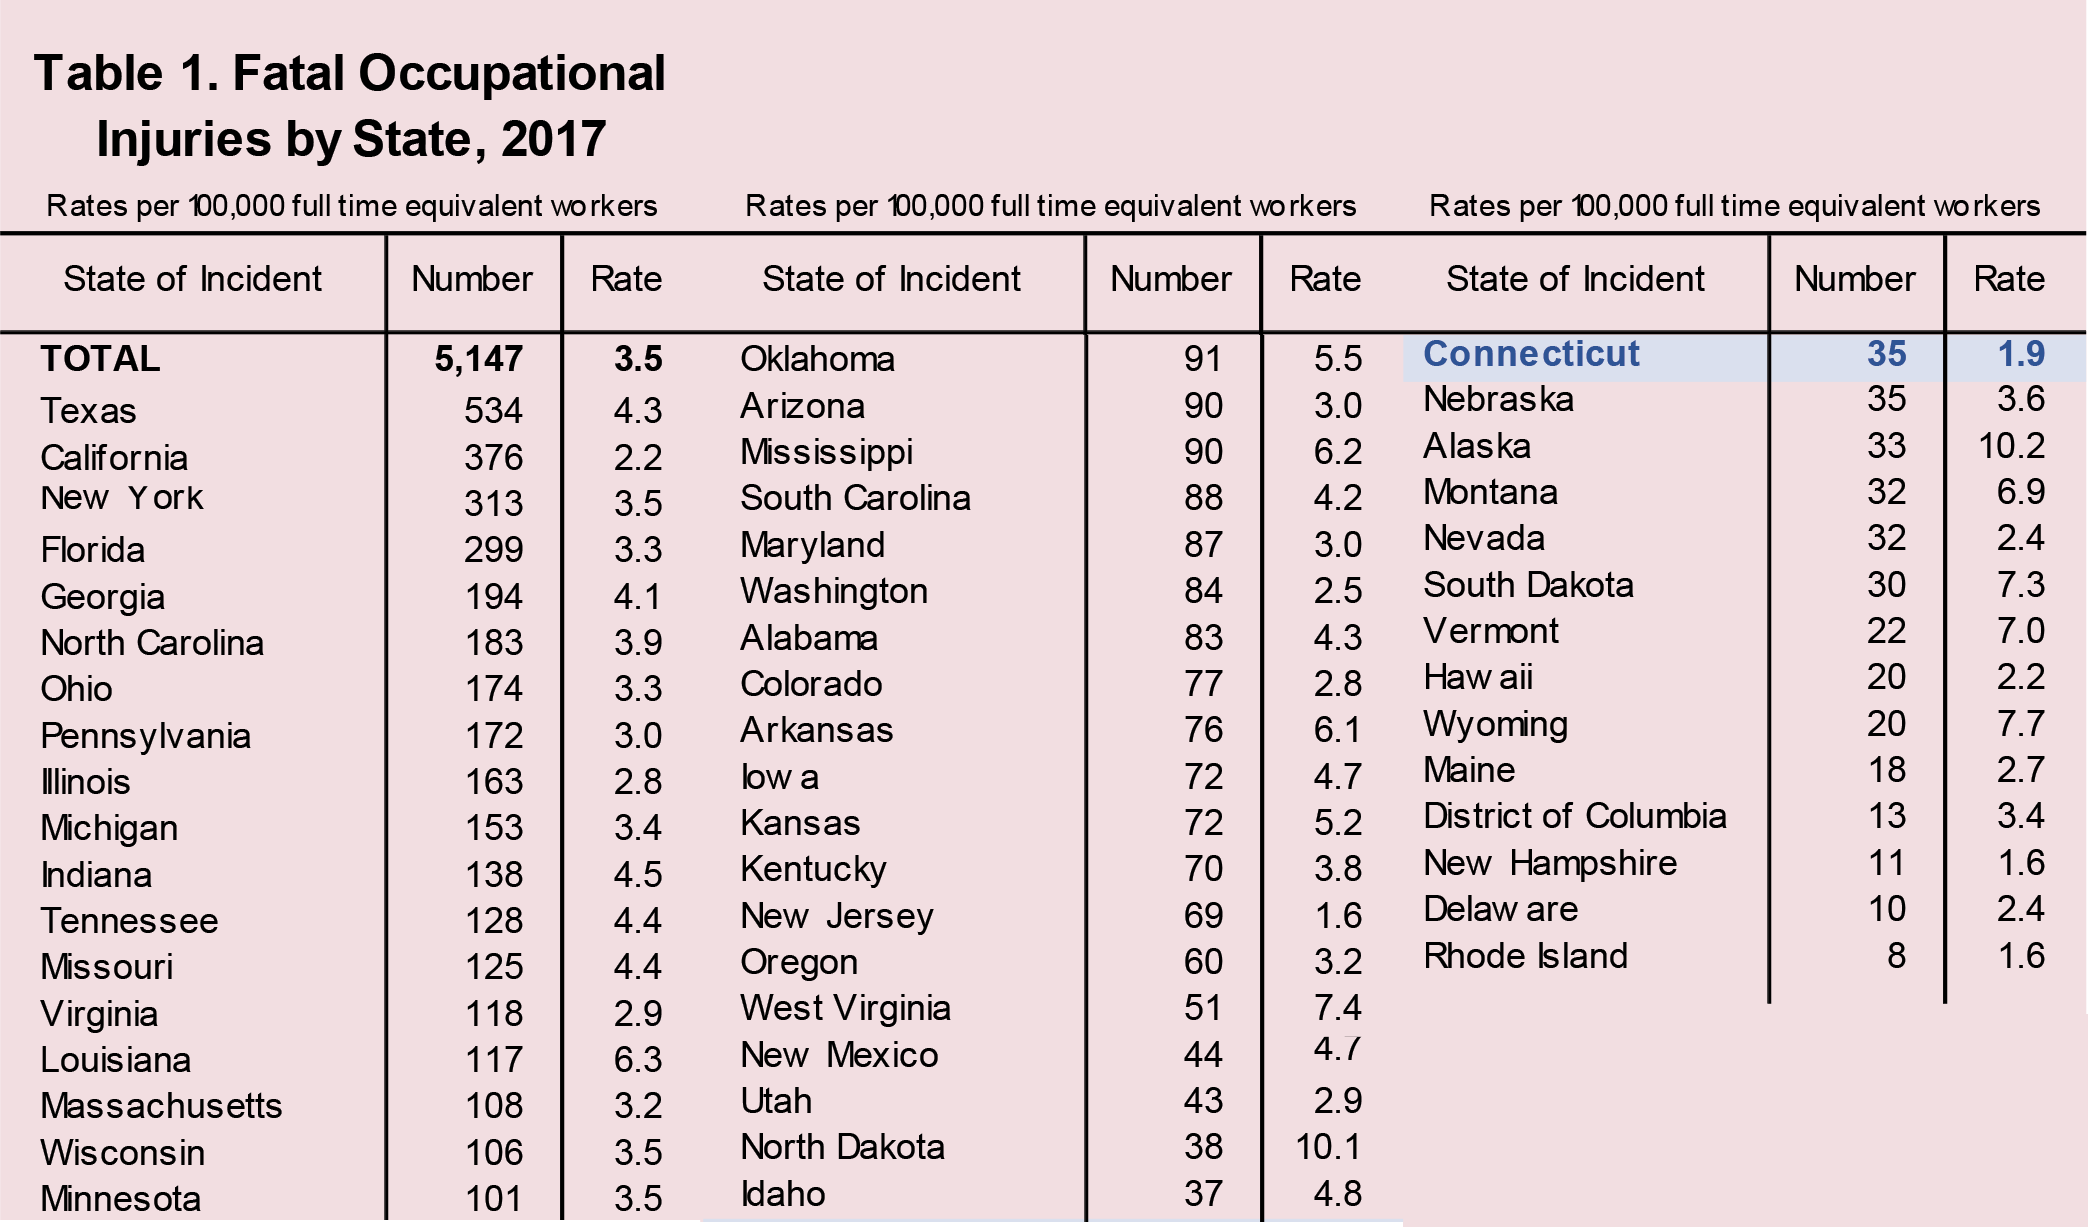
Connecticut lost 35 lives to work injuries in 2017. An increase from 2016’s count of 28, it is still below Connecticut’s annual average of 39 work-related deaths (Chart 1). At 1.9 deaths per 100,000 full-time equivalent workers, Connecticut had one of the lowest state rates (Table 1). New Hampshire, New Jersey, and Rhode Island, all with a rate of 1.6, were the only states with lower rates. While our lower number and rate is primarily due to low employment in high-risk industries, it cannot be stressed enough that even one work-related death is one too many.
Industry
The nation lost 5,147 lives to workplace injuries in 2017. The fatal injury rate decreased to 3.5 per 100,000 full-time equivalent workers from 3.6 in 2016. The highest loss was seen in Texas with 534 deaths, followed by California with 376 and New York with 313 deaths. Rhode Island recorded the lowest loss with 8 deaths. High rates were recorded in Alaska (10.2) and North Dakota (10.1).
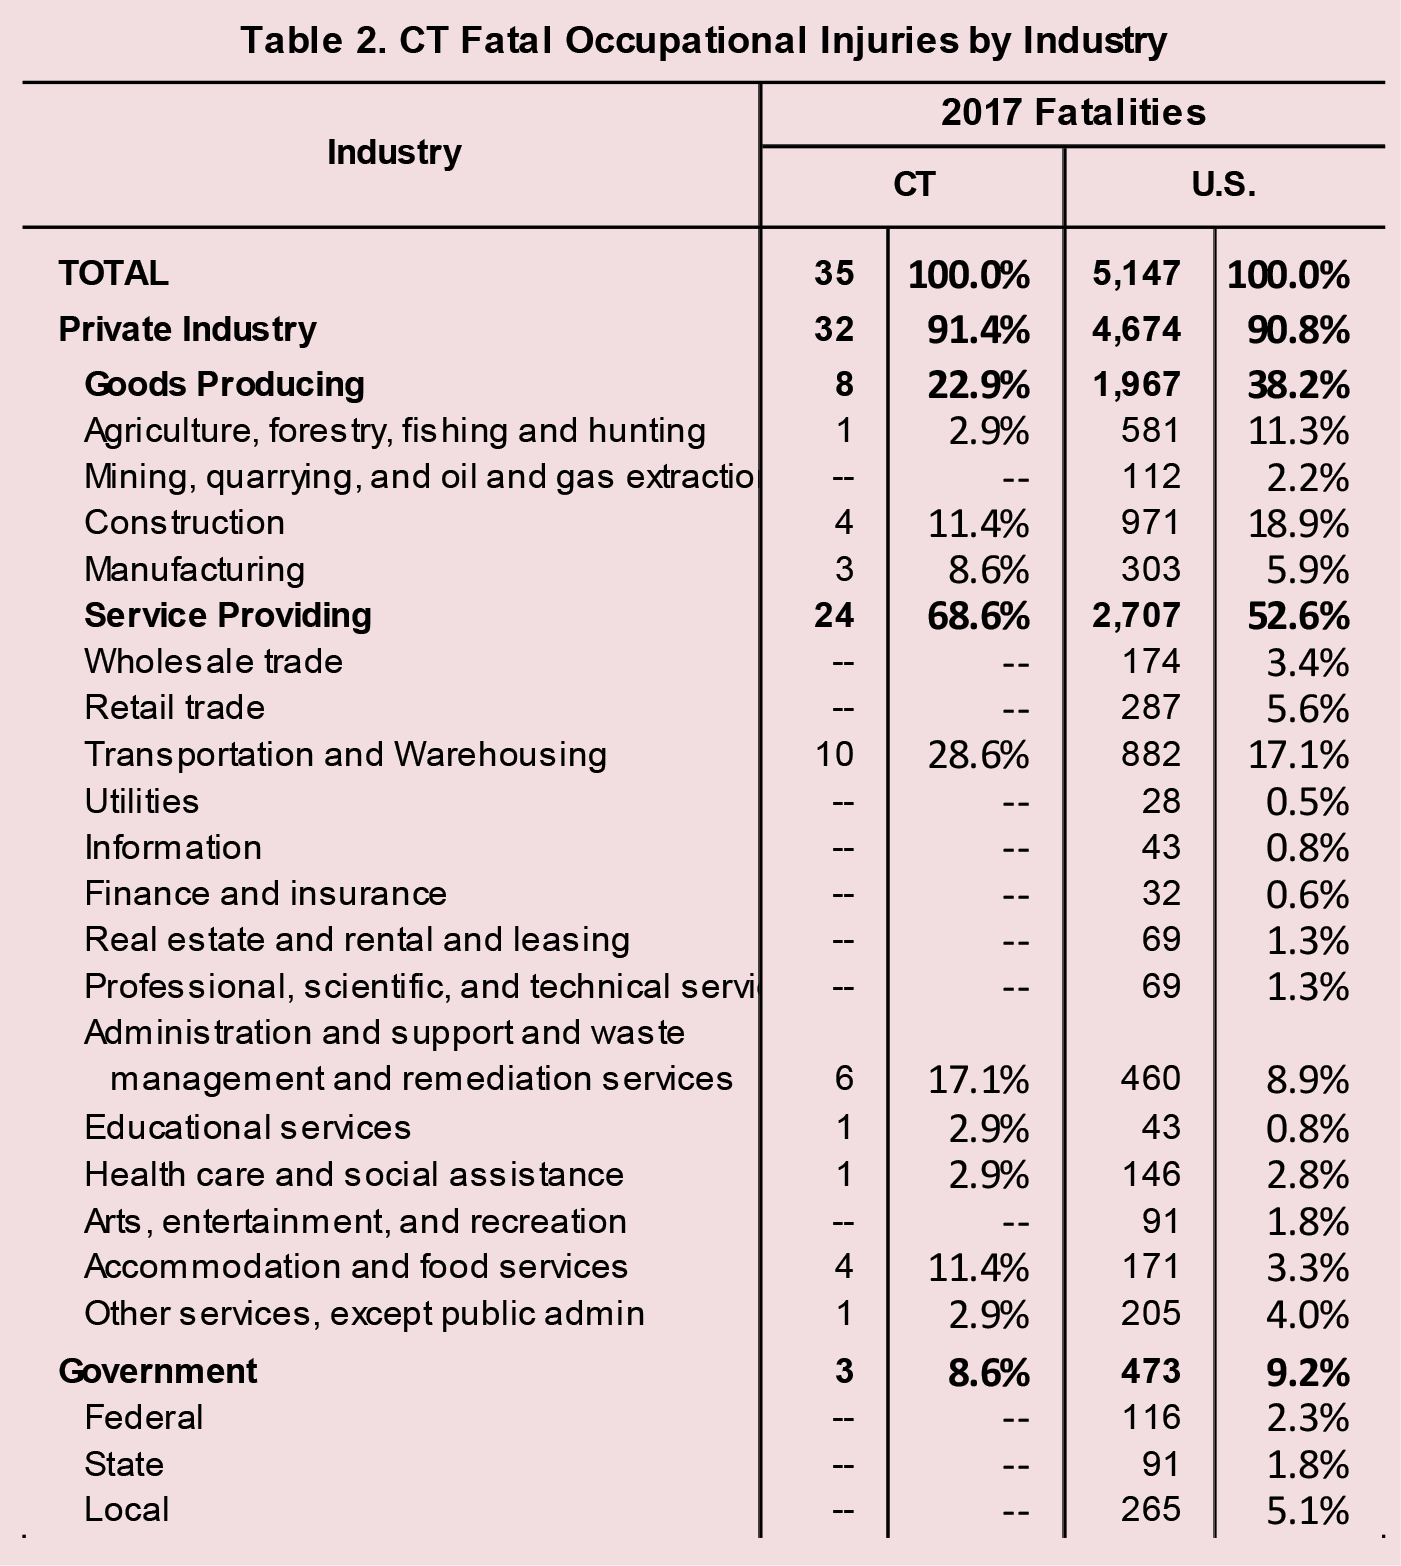
Nationally, the construction industry recorded the highest number of deaths at 971, followed by transportation and warehousing with 882. The highest rate by industry was seen in truck transportation, with 28.0 deaths per 100,000 full time equivalent workers.
With 10 deaths, the transportation and warehousing industry had the highest number of deaths in Connecticut, accounting for 28.6 percent of deaths in 2017. Administration and support and waste management and remediation services came in second with 6, accounting for 17.1 percent of total deaths. With an overall rate of 1.9 deaths per 100,000, Connecticut saw a rate of 16.7 in transportation and utilities and 3.1 in professional and business services. Rates for other industry sectors did not meet publishing criteria. The government sector recorded 3 deaths. (Table 2).
Worker Characteristics
Of Connecticut’s 35 work-related fatalities, 32 involved men. This follows the national trend with 93 percent of 2017’s work-related deaths being men. Twenty-eight were wage and salary and seven were self-employed workers. Seventy-one percent (25) of deaths were Caucasian. Four were Hispanic or Latino, three African-American, and three Asian. Six workers were foreign born. Nationally, foreign born workers made up 18 percent of total fatal injuries. Thirty eight percent of these workers were born in Mexico, followed by 19 percent from Asian countries.
Event
Historically, the United States loses the most workers to transportation incidents, and in 2017 there were 2,077 lives lost to transportation incidents – representing 40 percent of all work-related deaths. Falls, slips and trips was the second most common event with 887 (17 percent), followed by violence and other injuries by persons or animals with 807 deaths (16 percent). Workplace homicides claimed 458 lives and suicides claimed 275.
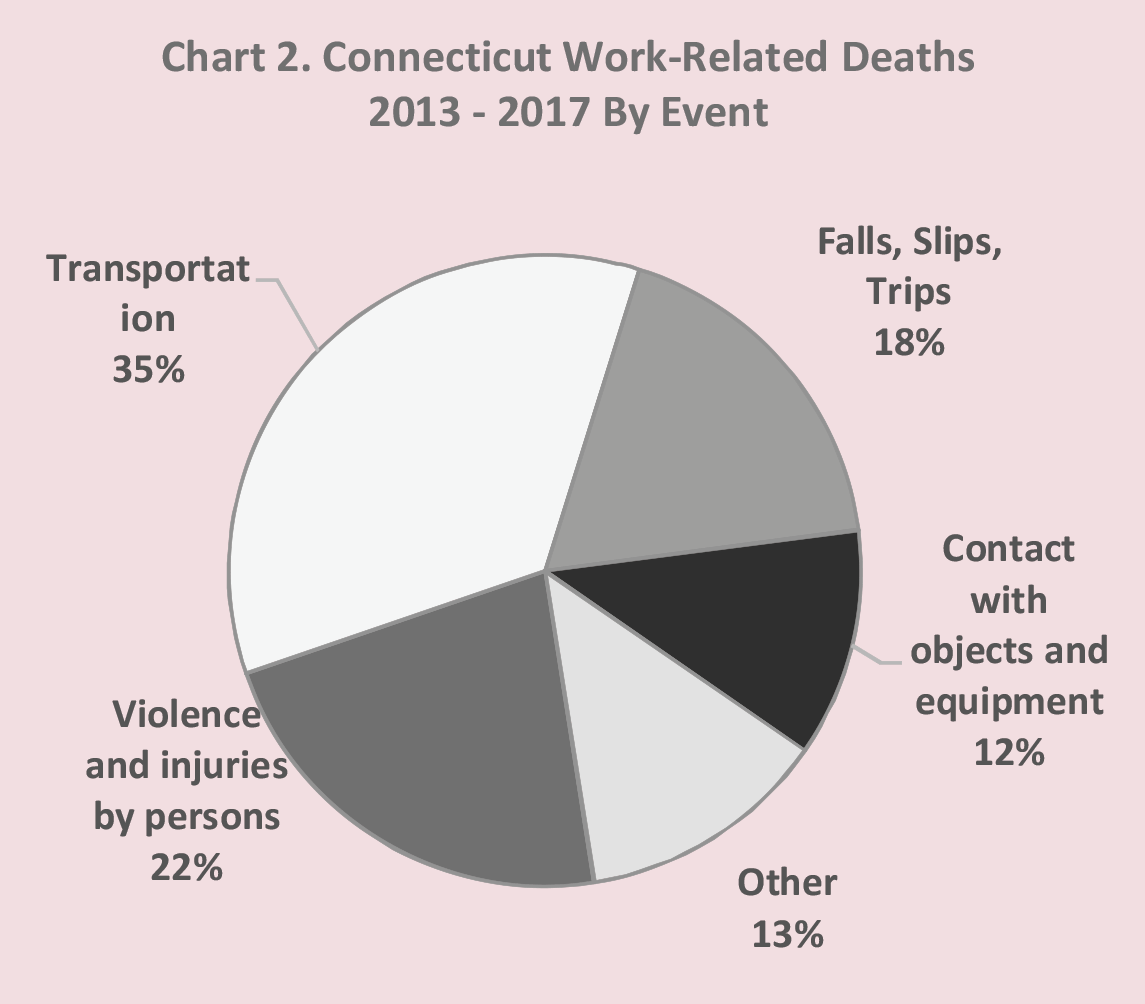
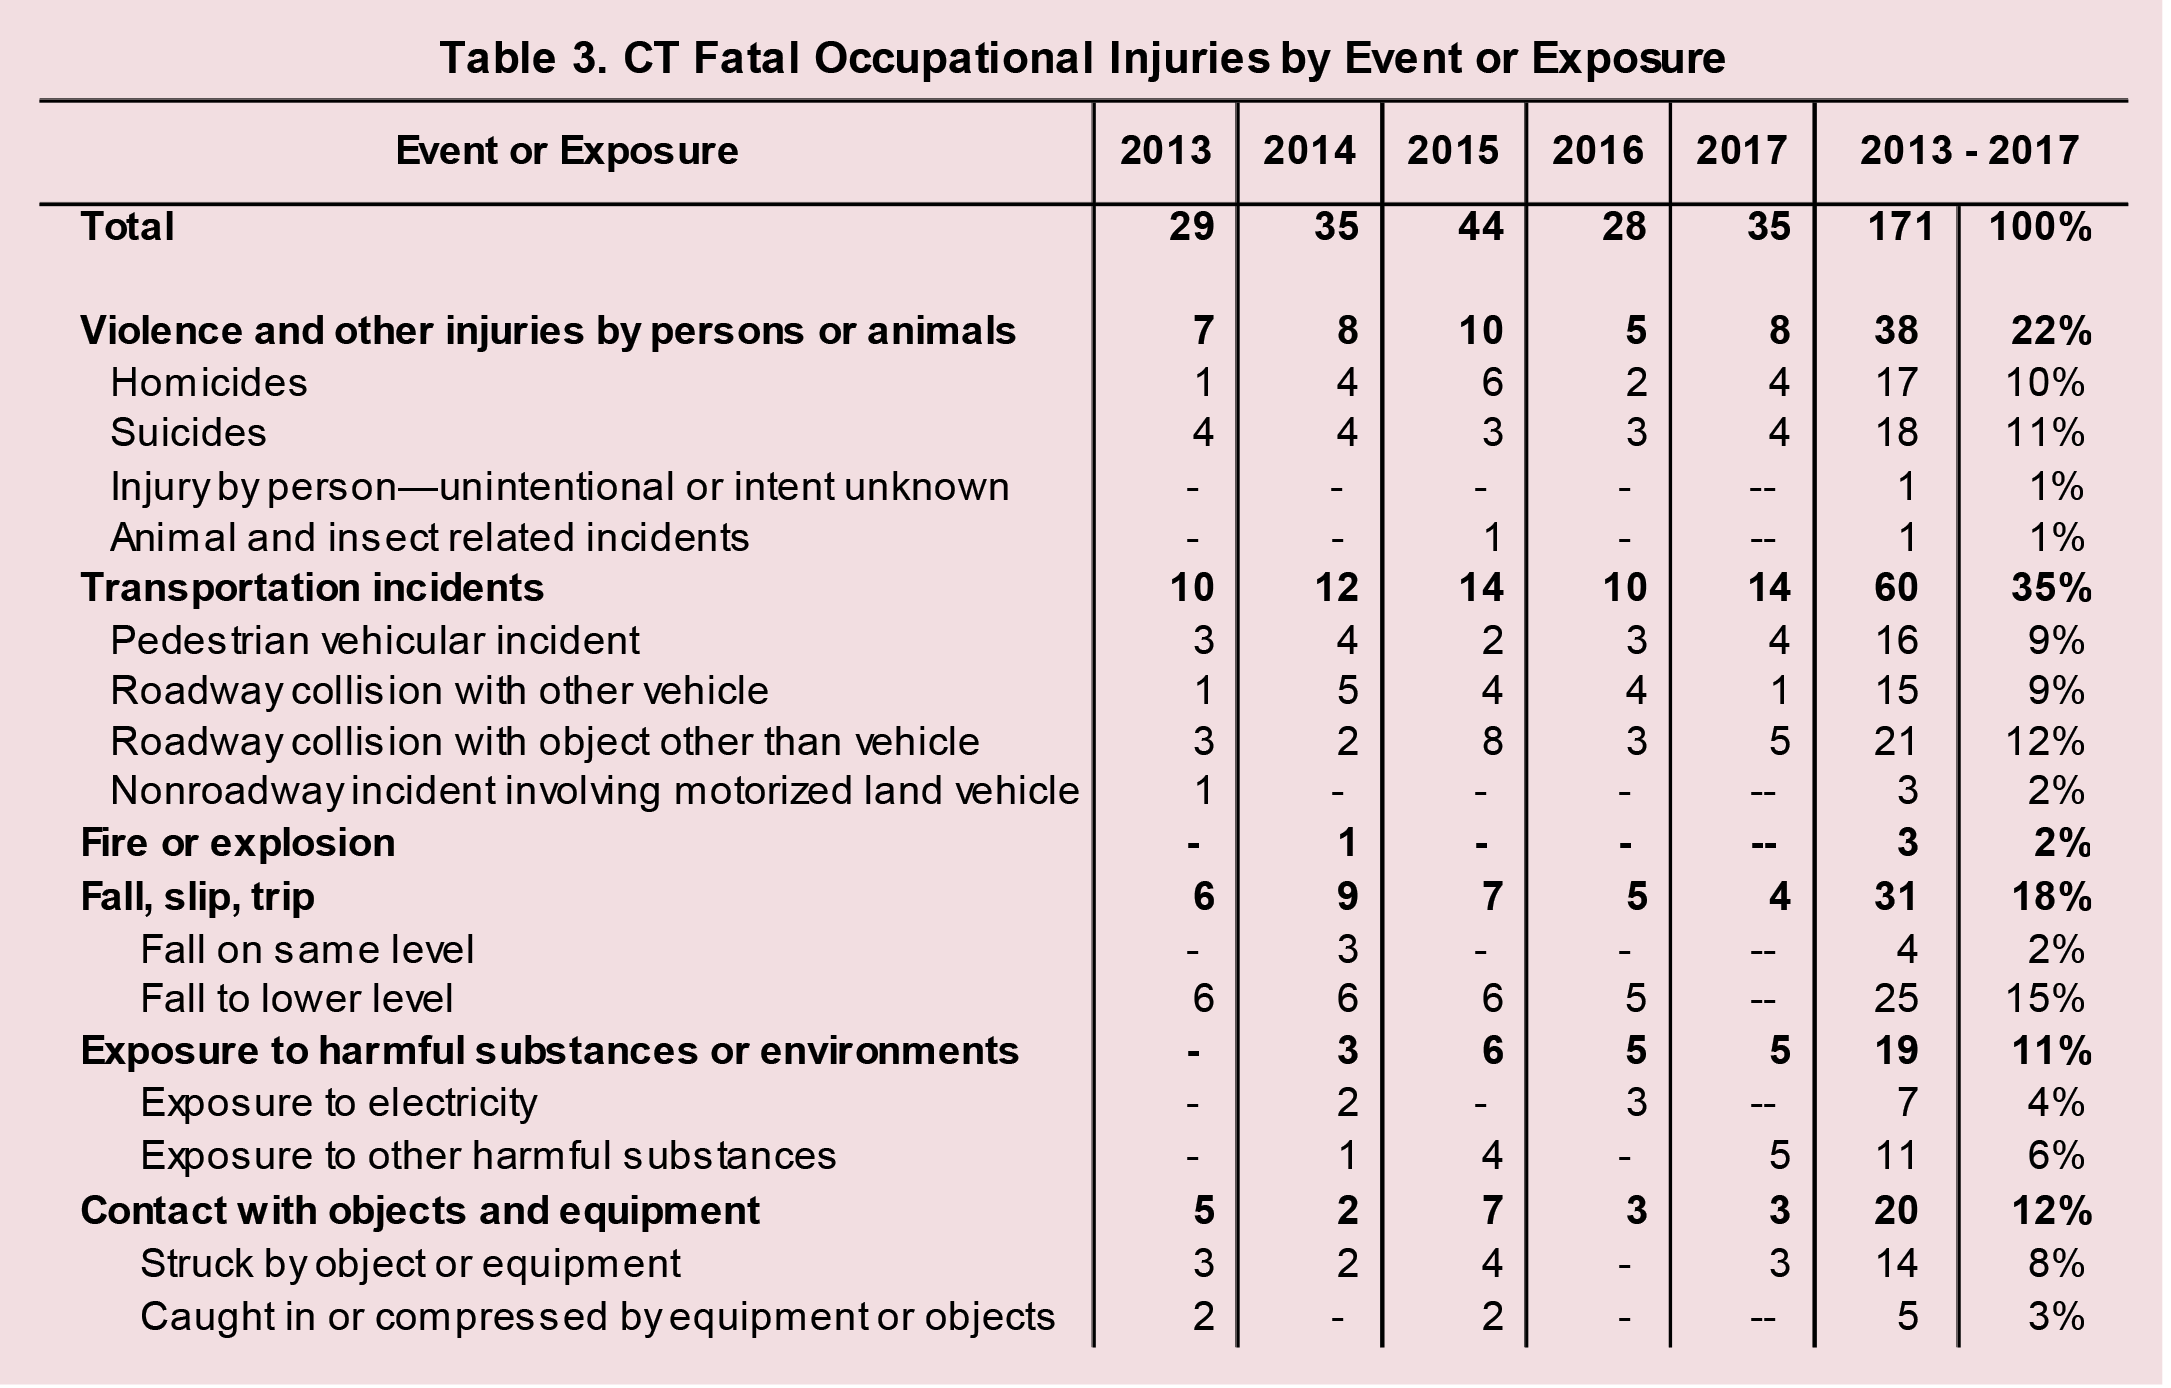
With 14 deaths, transportation incidents claimed the most lives in Connecticut, accounting for 40 percent of total deaths. Over the past five years, Connecticut has lost 171 lives to workplace injuries (Table 3) with 35 percent of them due to transportation events. Violence and other injuries by persons or animals claimed 22 percent, followed by falls, slips and trips at 18 percent (Chart 2).
Occupations
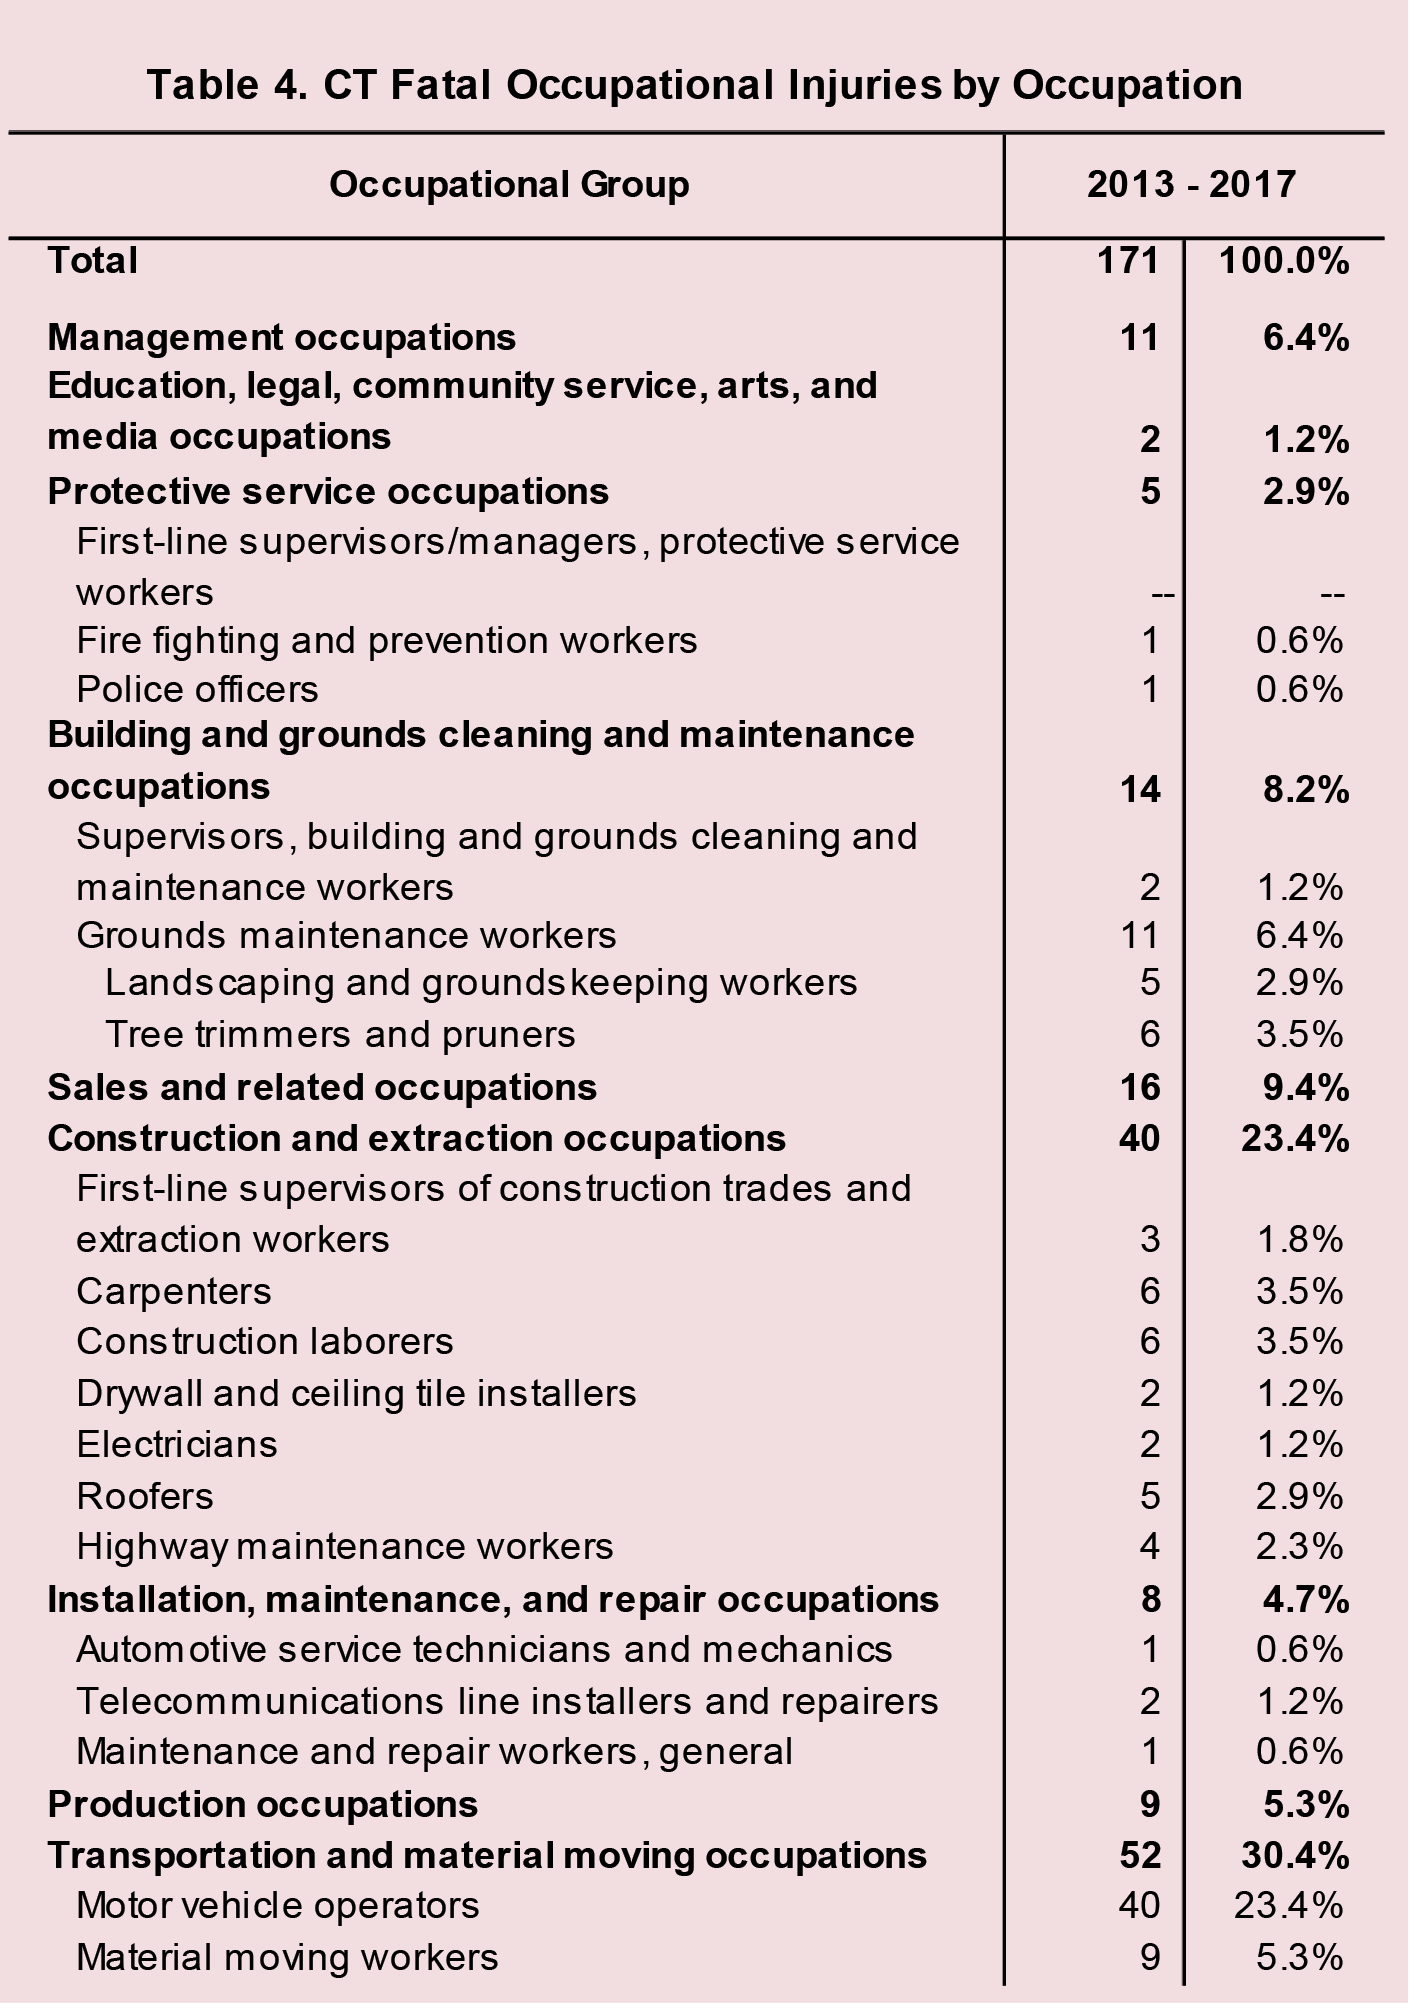
From 2013 to 2017, of Connecticut’s 171 work-related deaths, 30 percent were in the transportation and material moving occupations category. Within this category, 77 percent were motor vehicle operators, with material moving workers claiming an additional 17 percent. The construction and extraction occupational group, with 40 fatalities, came in second. Carpenters and construction laborers each had six deaths. Also in this category are drywall and ceiling tile installers, highway maintenance workers, and roofers (Table 4).
Nationally, the transportation and material moving occupational group and the construction and extraction occupational group accounted for 47 percent of worker deaths in 2017. Within the occupational subgroup, driver/sales workers and truck drivers, heavy and tractor-trailer drivers had the largest number of fatal occupational injuries with 840. This represented the highest figure for heavy and tractor-trailer truck drivers since the occupational series began in 2003. Fishers and related fishing workers had a high rate of 99.8 (41 deaths), followed by logging workers with a rate at 84.3 (55 deaths).
Identifying Work-Related Deaths
The CFOI (Census of Fatal Occupational Injuries) program requires a minimum of two sources to verify a work-related death. The media is often the first notice of a work-related death. Other resources include death certificates, coast guard reports, the NHTSA (National Highway and Traffic Safety Administration), and OSHA (Occupational Safety and Health Administration).
While every attempt is made to capture every work-related death, some are missed. The CFOI program uses diverse state, federal, and independent data sources to identify, verify, and describe fatal work injuries. This ensures counts are as complete and accurate as possible.
It is important to note that the Bureau of Labor Statistics holds all information on companies and the deceased in strict confidence. Information is never shared for compliance measures.
OSHA requires all employers to report workplace fatalities within eight hours. Included are small establishments and industries that are normally exempt from OSHA jurisdiction. Natural deaths, such as heart attacks, must also be reported. However, many employers are unaware of this requirement. Additionally, OSHA does not require employers to report all fatalities. Employers are not required to report:
- Street and transportation deaths unless they occur in a construction work zone
- Deaths on commercial or public transportation systems (airplane, subway, bus, train, etc.)
- Deaths occurring more than 30 days after the incident
OSHA does not investigate every work-related death. Homicides and most transportation incidents fall outside OSHA’s jurisdiction. However, OSHA is beginning to investigate some of these incidents to develop training programs. Homicides may be prevented with changes in security cameras and enforcing safety rules. Transportation deaths can be prevented with training programs on distracted driving, sleep deprivation, and safe driving techniques.
History of the Program
When President Nixon signed the Occupational Safety and Health Act of 1970 (OSHA) into law, a census of workplace fatalities did not exist. It was estimated that approximately 14,000 workers were killed on the job annually. While OSHA immediately began investigating workplace deaths, the U.S. Department of Labor did not have a comprehensive statistical program dedicated to documenting them.
In 1992, the Bureau of Labor Statistics’ Census of Fatal Occupational Injuries (CFOI) was established to track all work-related deaths and collect the much needed data. That first year, 6,217 deaths were documented nationally, with 42 in Connecticut. Since then, national numbers have dropped by 17 percent to 5,147 in 2017.
Since 1992, the CFOI program has seen several changes. Prior to 2006, rates were calculated per 100,000 workers. Now the rates take into account the number of hours spent in the workplace, resulting in rates per 100,000 full-time equivalent workers. The coding structure for nature, part of body, event, and sources was changed in 2011. In 2012, the program began documenting contractor status, the use of drugs or alcohol, seat belt use, and union status.
Most recently, there has been a change in the release of data. Formerly, a preliminary release was made in August or September with revised, final data published in April of the following year. Beginning with the 2015 reference year, final data is now released in December – four months earlier than in past years. This December release is the only release of CFOI data.
The program continues to develop to meet the needs of researchers. Hopefully the data will continue to be used to create engineering solutions, regulations, and education programs to minimize workplace fatalities
