Covered Employment and Wages: A 2018 Annual Review
By Jonathan Kuchta Jonathan.Kuchta@ct.gov, Research Analyst, Connecticut Department of Labor
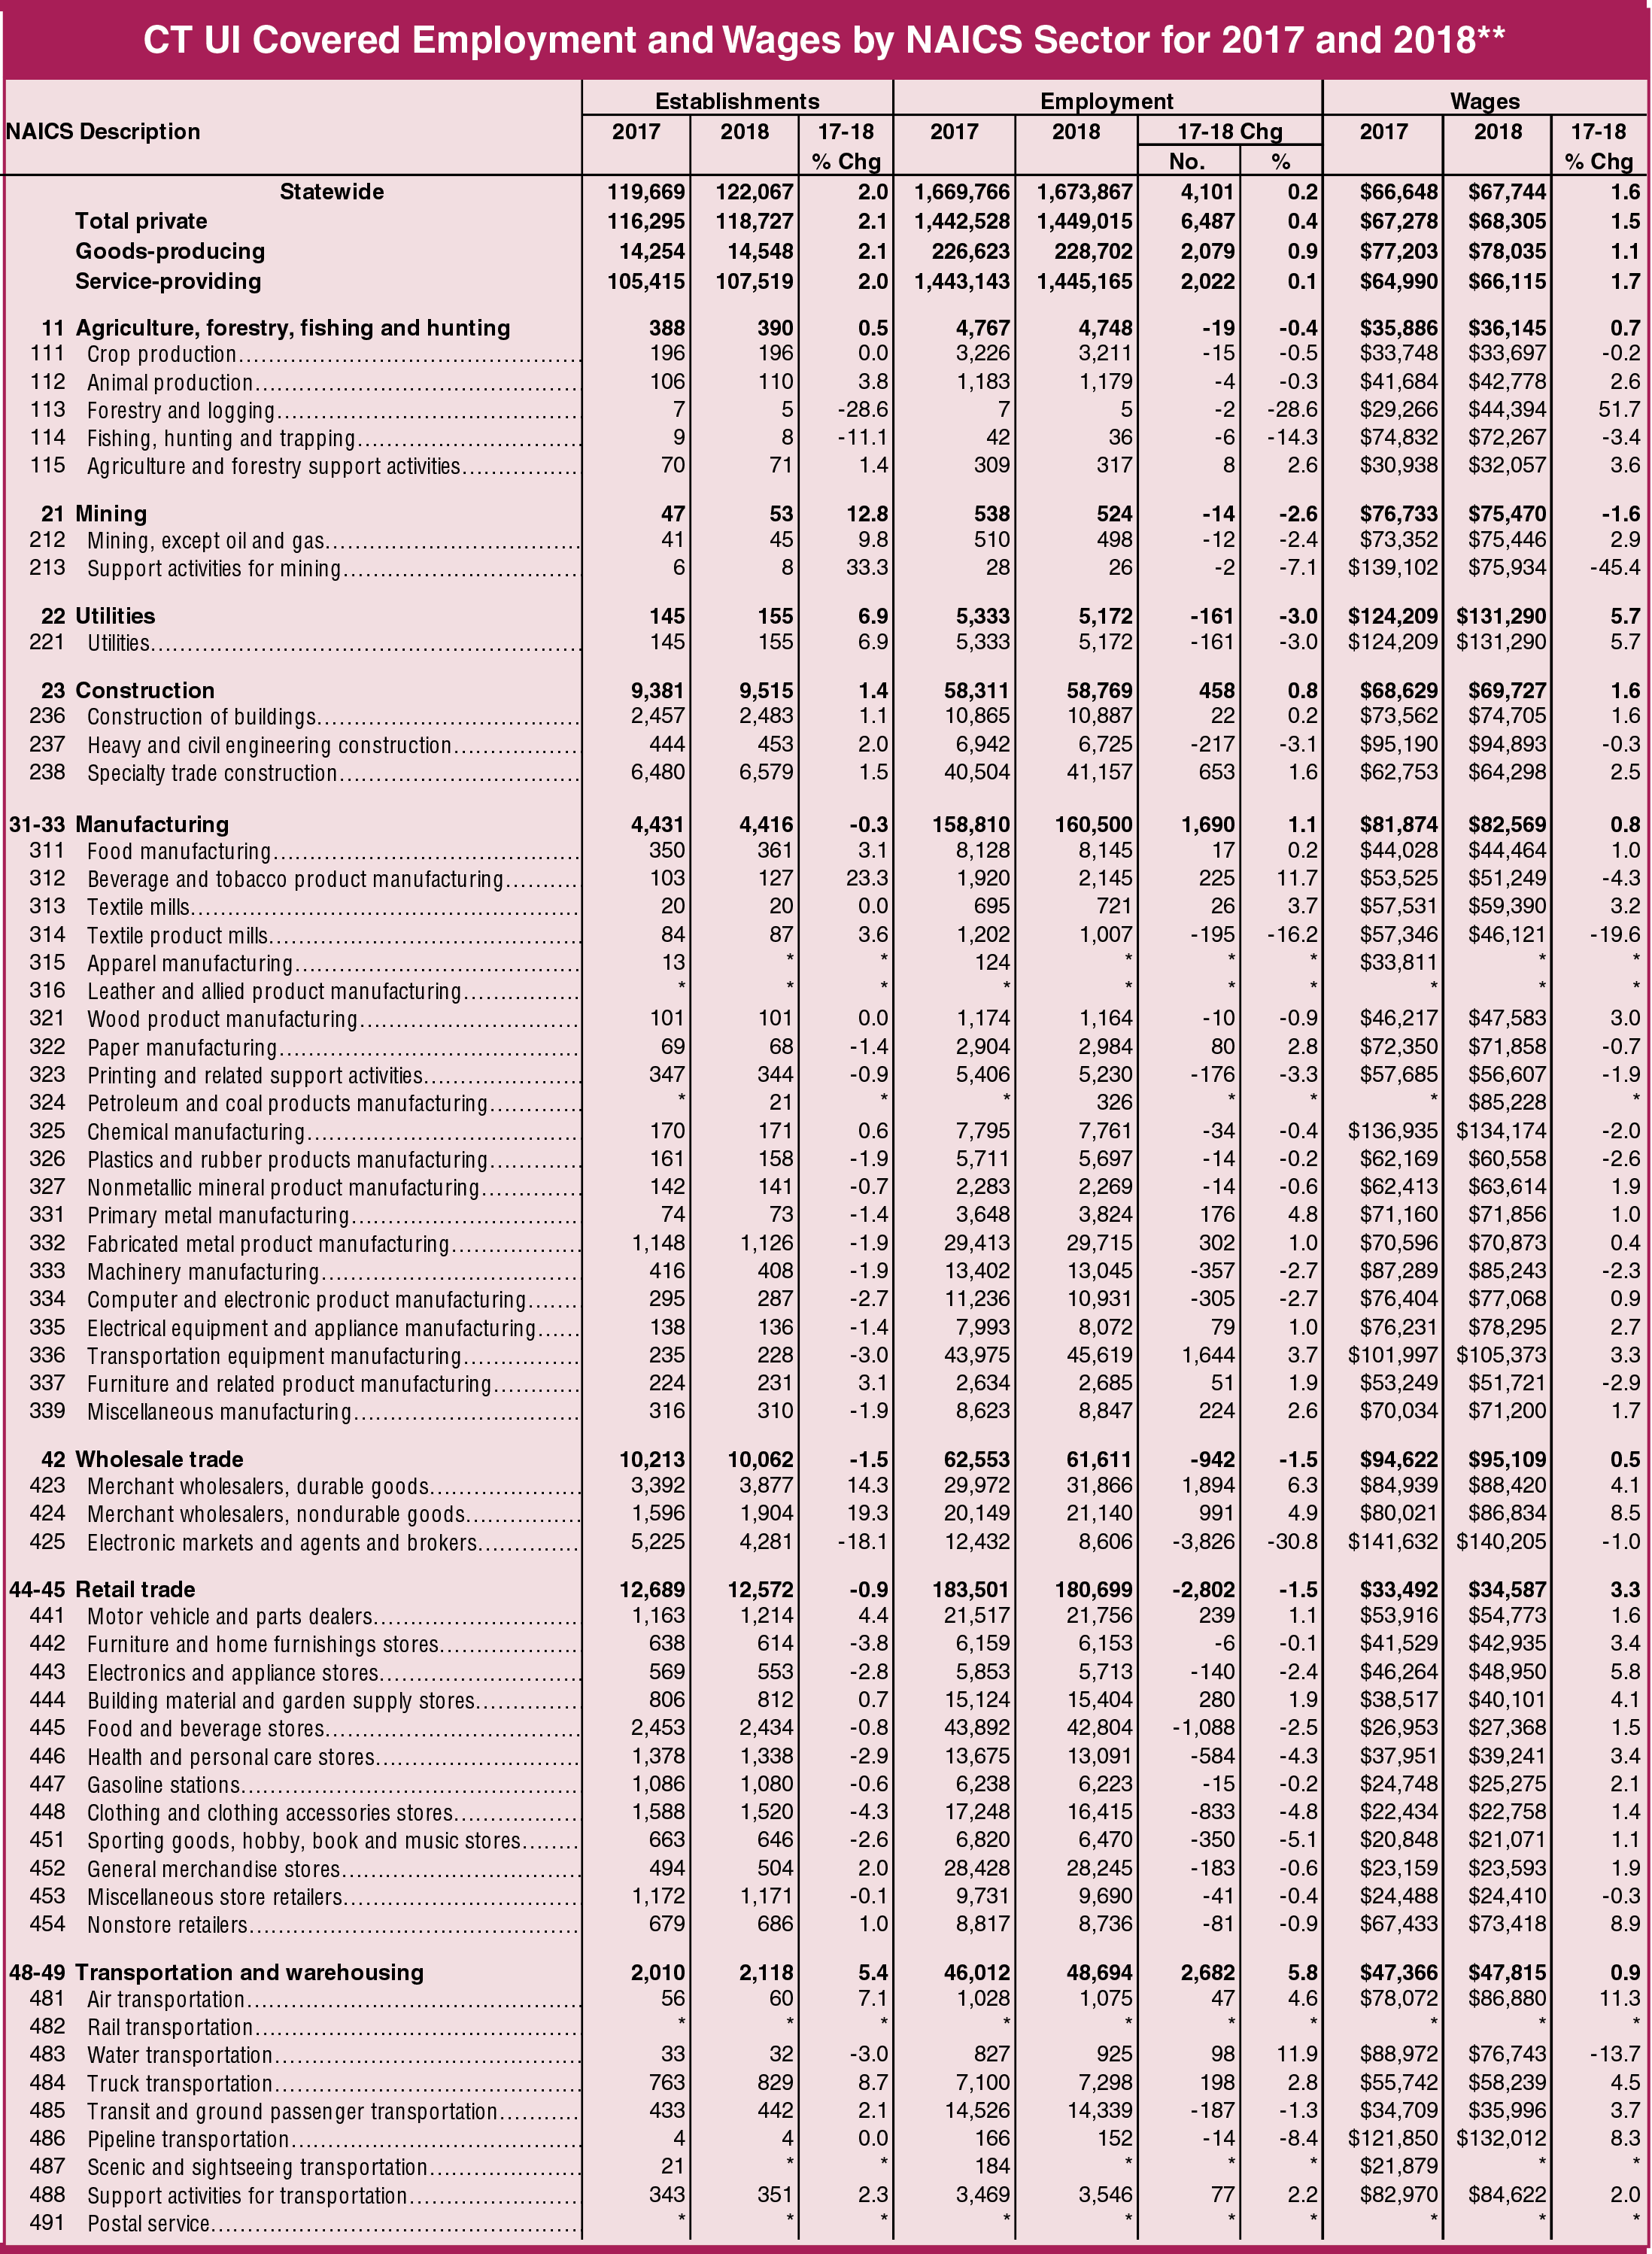
 ccording to the most recent data published by the Quarterly Census of Employment and Wages (QCEW) program, the number of jobs in Connecticut increased by 0.2 percent during 2018.
 Connecticut continues to show slow but steady employment growth since the Great Recession. Total private industry employment, constituting 86.4 percent of the state’s employment total, increased by 0.4 percent. Total government employment decreased by 1.1 percent year-over-year.
Average annual wages for all Connecticut jobs increased by 1.6 percent, to $67,744, an improvement on the increase in 2017. In 2018, private sector wages increased by 1.5 percent to $68,305; government wages increased 2.4 percent to $64,126.
The number of business establishments continued their expansion, with a new total of 122,067, an increase of 2.0 percent over 2017. Total private establishments represented the entirety of the increase, reaching 118,727 in 2018. Government worksites decreased 1.0 percent in the state, from 3,374 in 2017 to 3,340 in 2018.
Employment
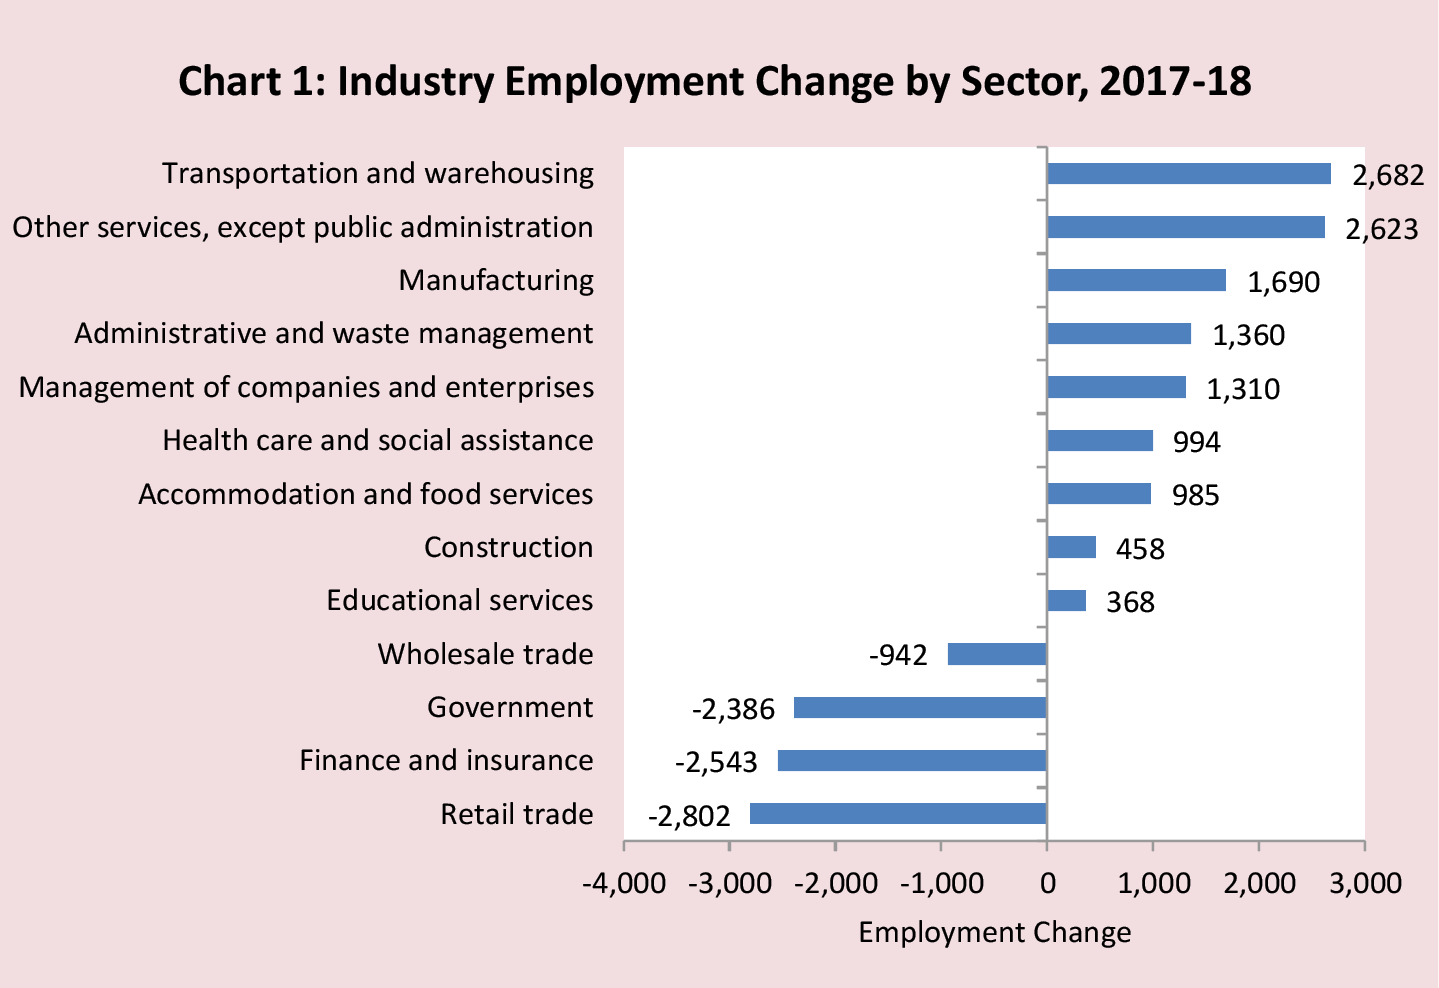
Looking at the sectors with notable gains in 2018, several industries continued to improve from their 2017 levels. The transportation and warehousing, manufacturing, and other services sectors all showed solid increases. Transportation and warehousing was the largest gainer last year, expanding by 2,682 jobs (Chart 1). This was nearly double the gain of the previous year, when the sector gained 1,343 jobs. The other services (except public administration) sector saw marked growth over the past year, nearly equaling transportation’s gains with 2,623 jobs added. Manufacturing showed continued improvement in 2018, gaining 1,690 jobs.
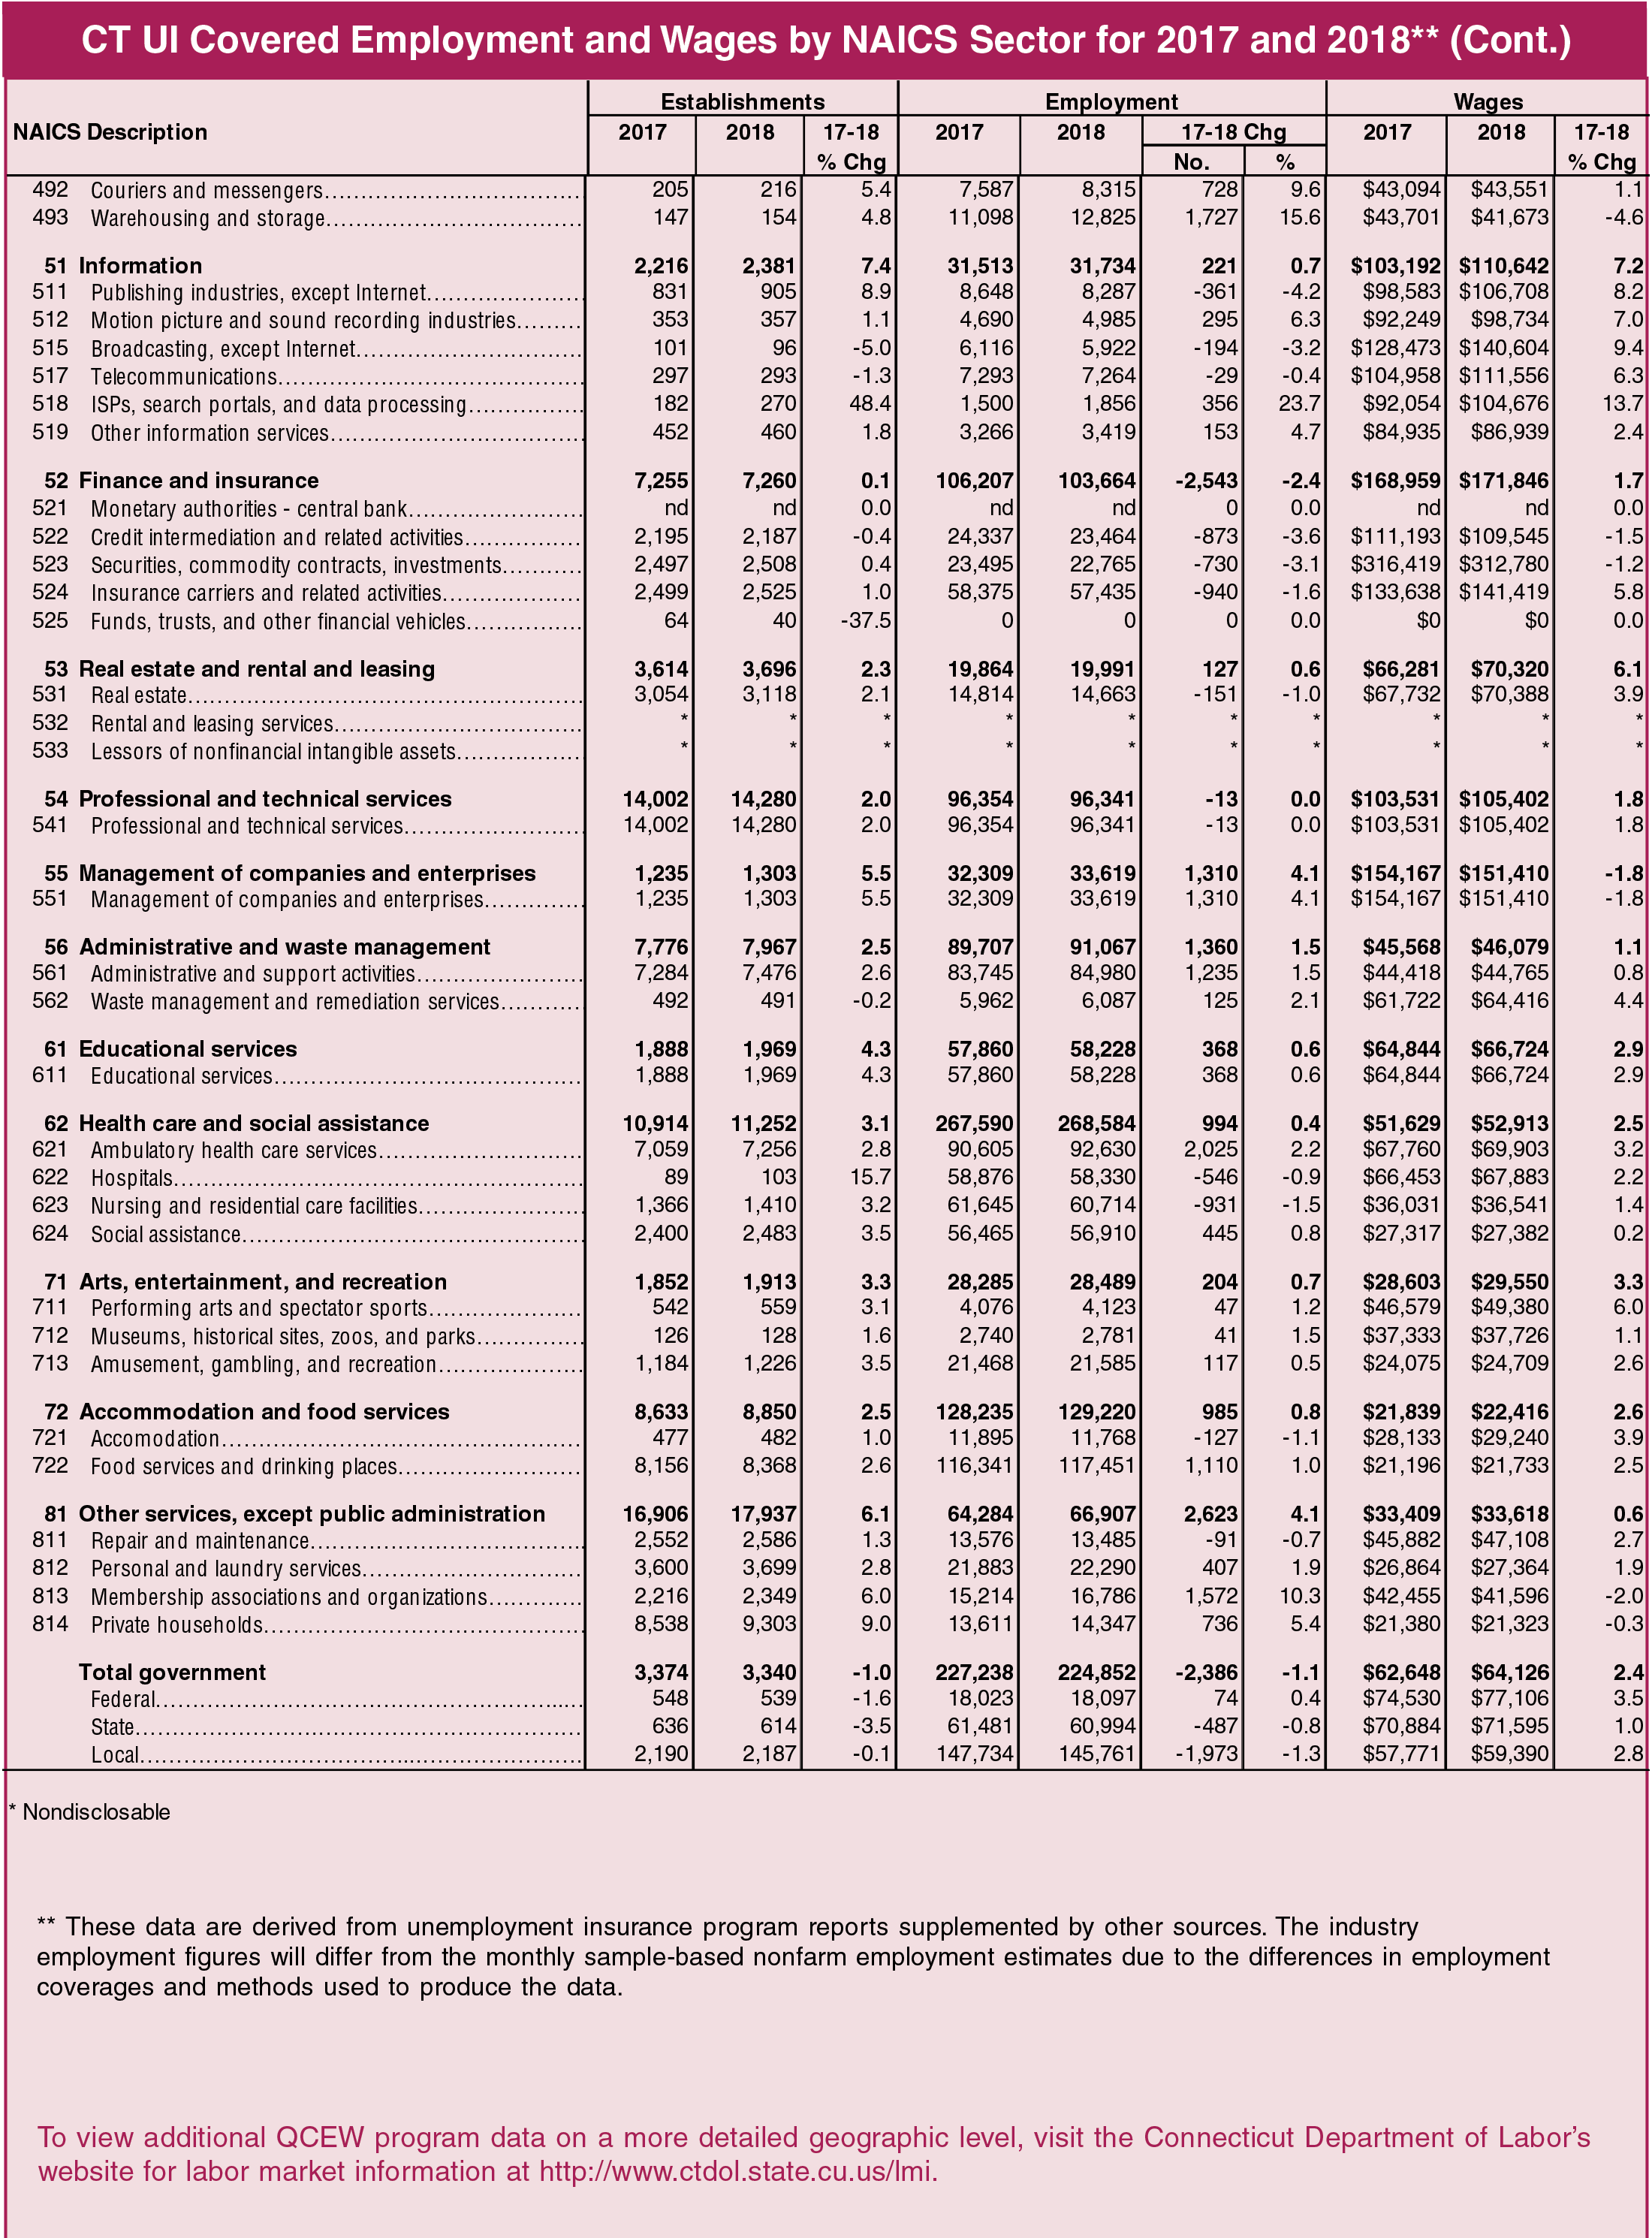
For sectors that declined in 2018, retail trade dropped the most, with a loss of 2,802 jobs, and finance and insurance was close behind with a drop of 2,543 jobs. Government employment also continues to shrink in the state, down by 2,386 jobs. See pages 3 and 4 for data on other industry sectors and subsectors.
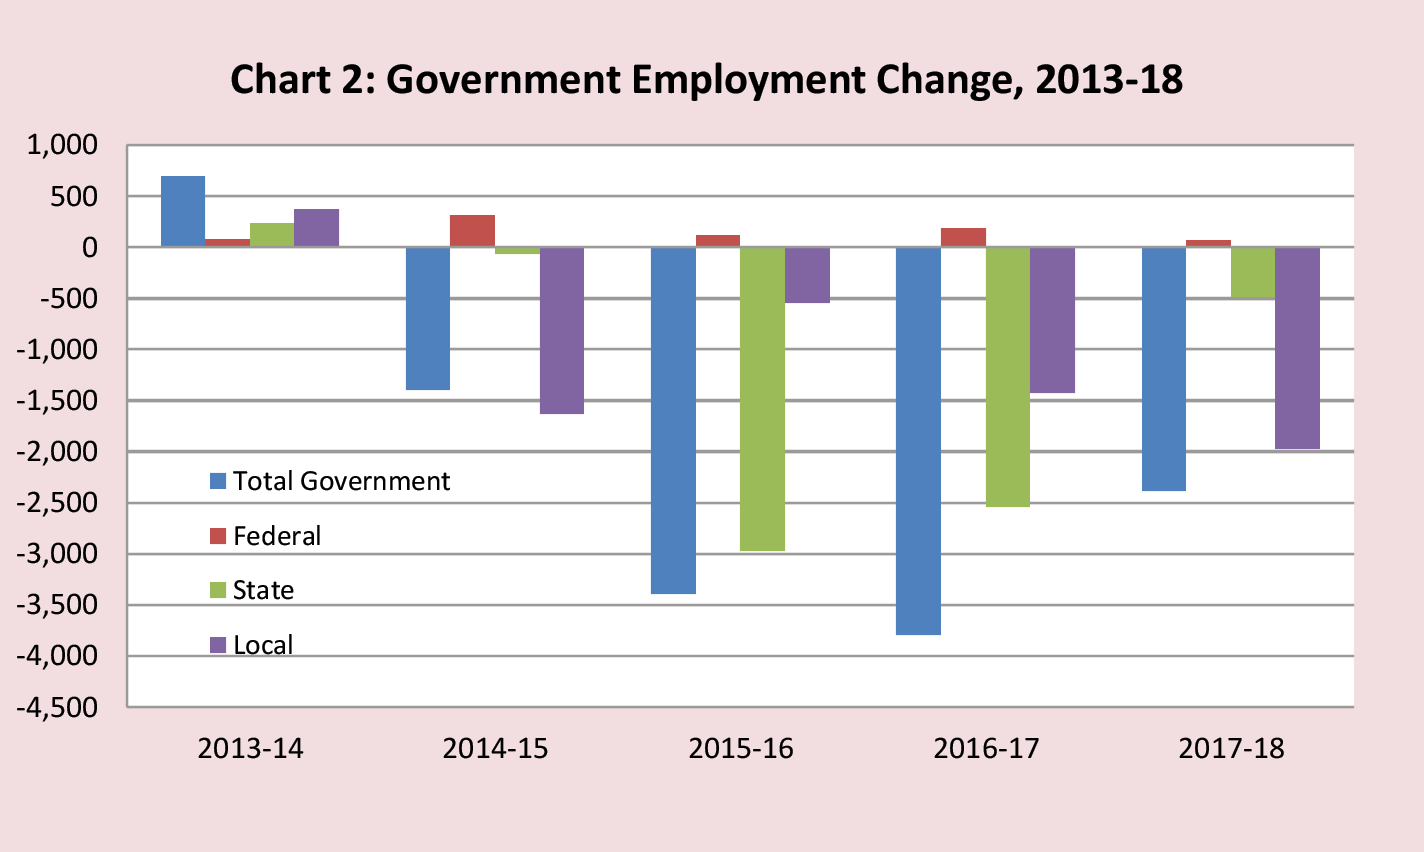
Much of the loss in government was due to retirements and hiring freezes; this trend will likely continue into the 2019 annual data. While the drop in state government was significantly less over the year, declining by 487 jobs, local government employment dropped by 1,973, an increase over last year (Chart 2). Within local government, these losses are found primarily in education and public administration.
The Bureau of Labor Statistics (BLS) aggregates the North American Industrial Classification System (NAICS) sectors to form the top level goods-producing and service-providing “domains”. Goods-producing sectors include agriculture, forestry, fishing, and hunting; mining; construction; and manufacturing. The remaining sectors are aggregated into the service-providing domain.
For 2018, the goods-producing domain encompassed 13.7 percent of total covered employment, with the remaining 86.3 percent in the service-providing domain. The goods-producing employment grew by 2,079, or 0.9 percent, with service-providing employment growing by 0.1 percent, or 2,022, at the same time.
Wages
Connecticut average annual wages varied greatly between industries and within each sector in 2018. It should be noted that much of this difference in pay level can be attributed to factors such as hours worked (full- or part-time), workforce composition, wages, including bonuses or stock options, and seasonal and weather related influences.
The highest annual average wage, found in the finance and insurance sector, was $171,846 - 2.5 times the state average. Those in the securities, commodity contracts and investments subsector earned an average of $312,780 in 2018. The management sector was not far behind finance and insurance at $151,410. Overall, wages showed improved growth over 2017, at 1.6 percent, with five sectors showing more than 3.0 percent growth. Mining and management of companies were the only two sectors showing declines.
At the other end of the spectrum, accommodation and food services workers earned the least, at $22,416. This increase of 2.6% was greater than the state average, though it is heavily influenced by part-time workers. Next were arts, entertainment and recreation at $29,550 and other services, except public administration, at $33,618 in annual wages.
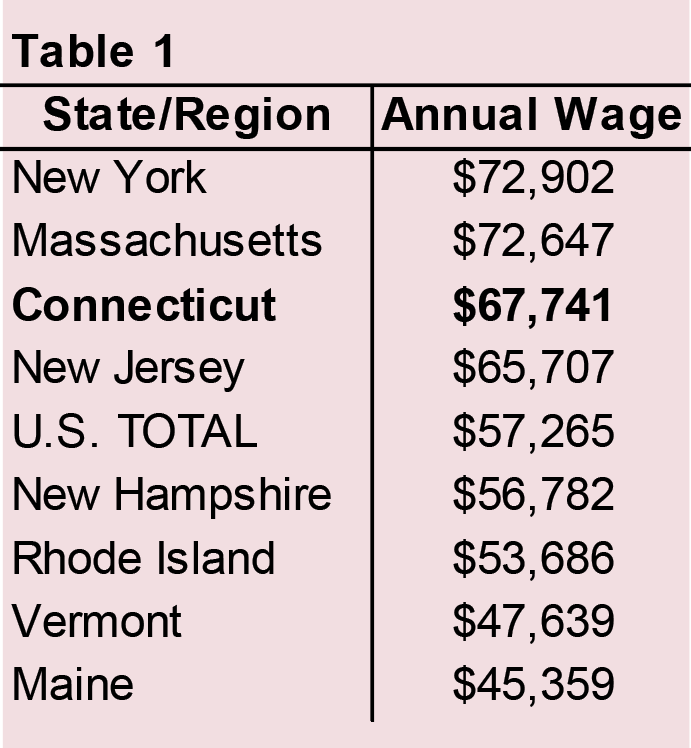
2018 was a decent year for wages in general, as all but two sectors experienced some wage growth. Goods-producing wages showed an increase of 1.1 percent compared to 2017, at $78,035. They are 15.2 percent above the annual average for all industries. Service-providing wages experienced growth, rising to $66,115, an increase of 1.7 percent on an annual basis. Connecticut continues to maintain comparable annual wages to nearby states in the Northeast, coming third behind only New York and Massachusetts (Table 1). Average wages in Connecticut are 18.3 percent above the U.S. average, declining slightly from last year’s 20.4 percent premium.
