2018 Unemployment Rate by Town
By Jungmin Charles Joo and Dana Placzek, Department of Labor
In 2018, the annual average statewide unemployment rate was 4.1%, down from 4.7% in 2017. For the eighth year, most municipalities experienced a decline in their unemployment rate, even more than fell in 2017.
2017 to 2018
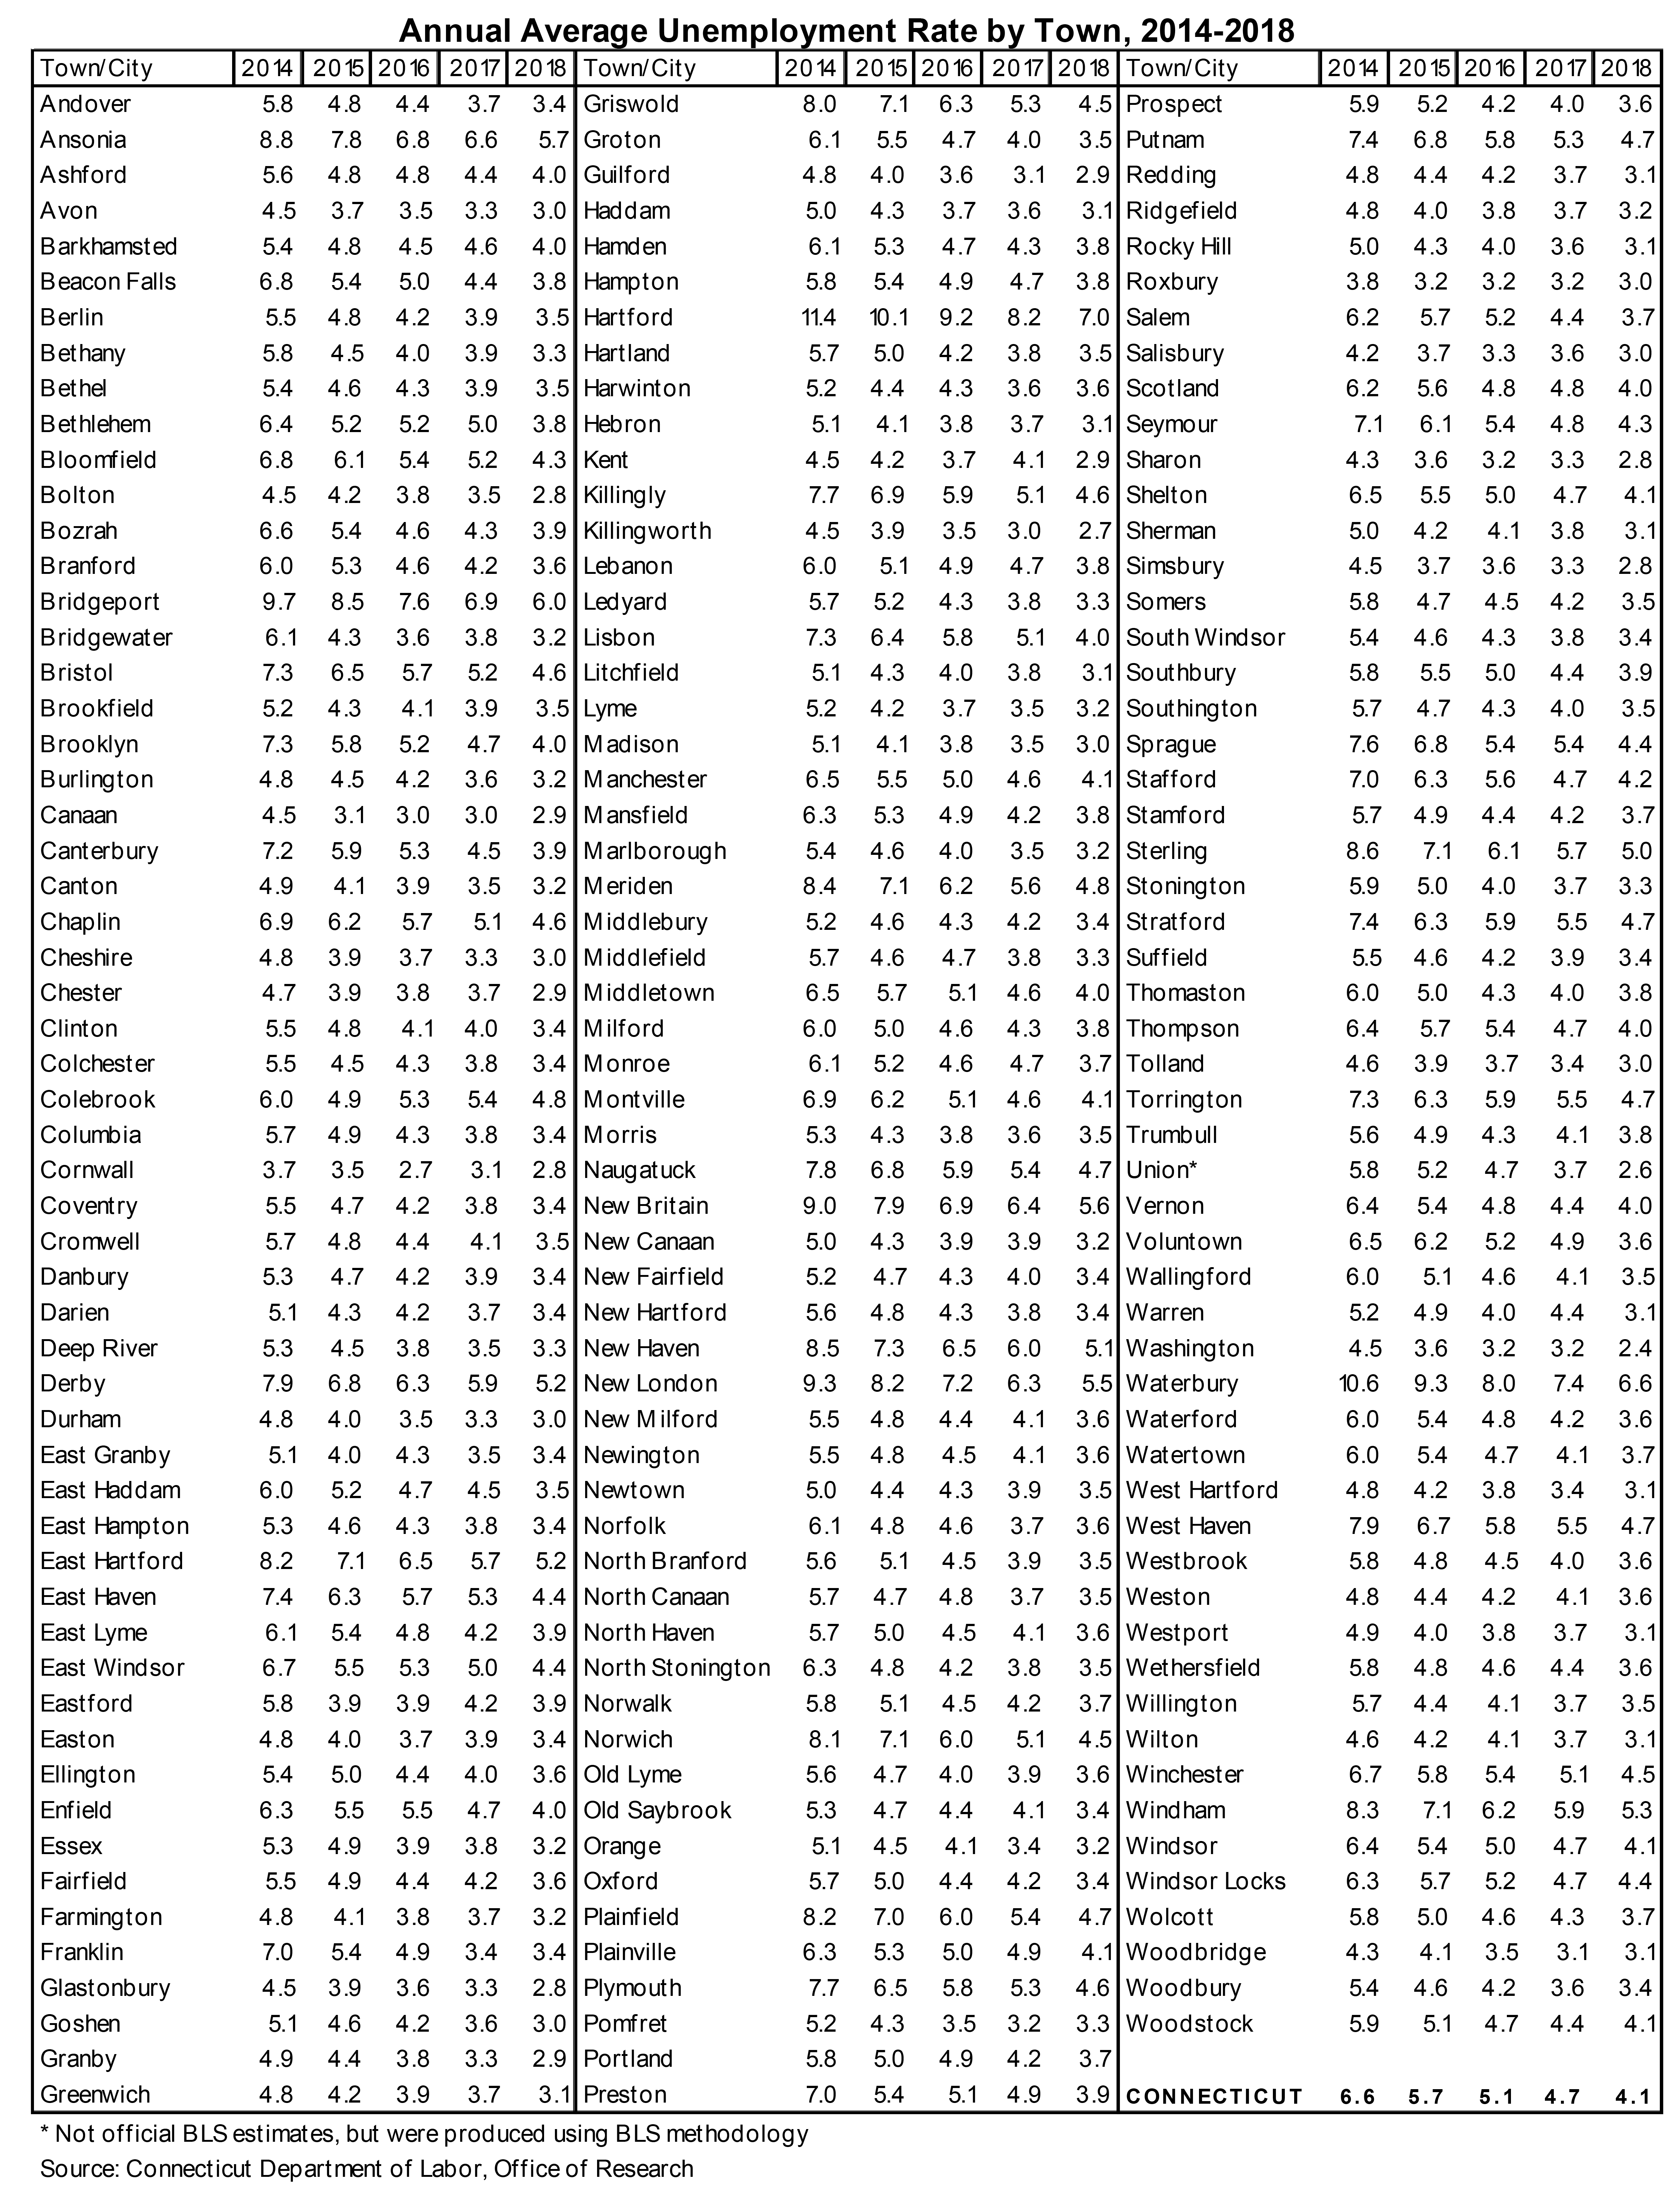
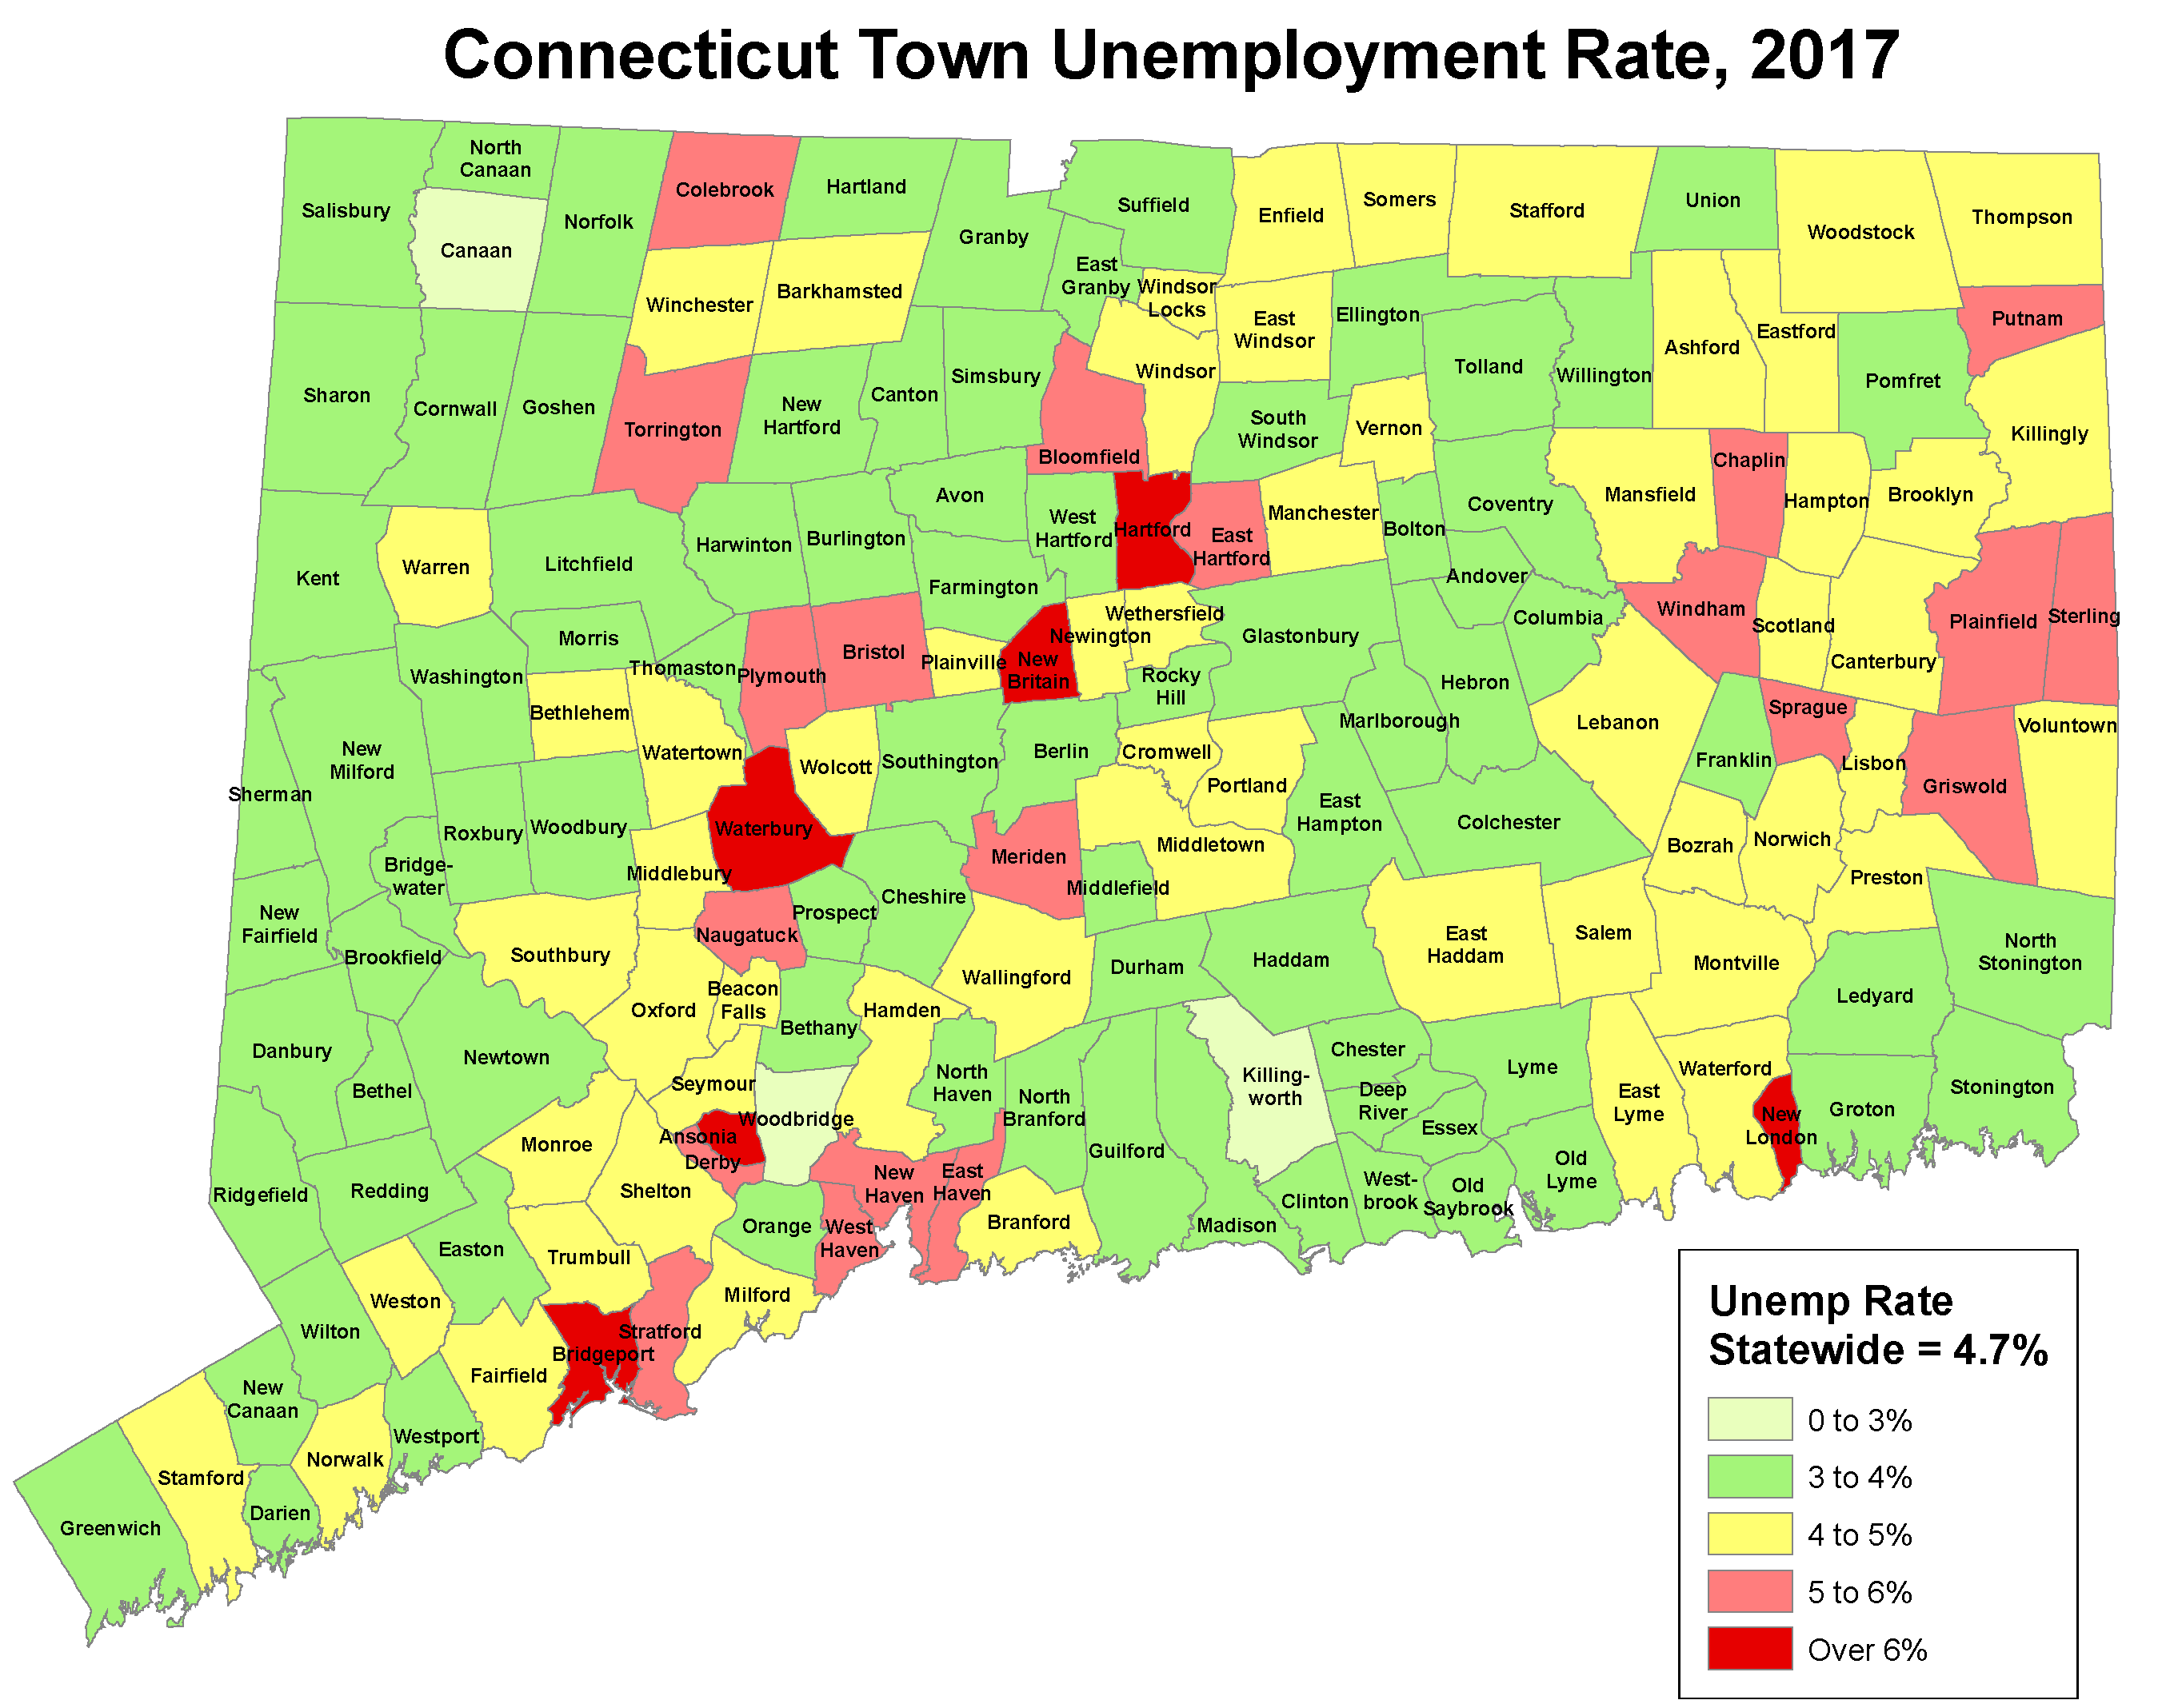
Of 169 cities and towns in the state, the unemployment rate fell in 165, rose in 1, while 3 were unchanged in 2018. On the other hand, 152 were down, 11 were up, and 6 remained the same in 2017. Washington had the lowest unemployment rate of 2.4%, while the residents of Hartford experienced the highest rate of 7.0% last year (see table on page 3 for the complete town data). Overall, a total of 130 cities and towns had jobless rates below the 2018 statewide figure of 4.1%, 33 had rates above it, and six had rates equal to it. By comparison, 122 cities and towns had rates below the 2017 statewide average of 4.7%, 37 above it, and 10 were the same.Of the five largest cities in the state with a 2010 Census population of 100,000 or more, Stamford had the lowest unemployment rate of 3.7% in 2018. Hartford posted the highest jobless rate among the large cities at 7.0%, but also had the largest decrease over the year (-1.2 percentage points). All five cities experienced over-the-year unemployment rate decreases. The map on page 4 also shows the unemployment rates for each town in 2018.
Town Unemployment Rate Diffusion Index
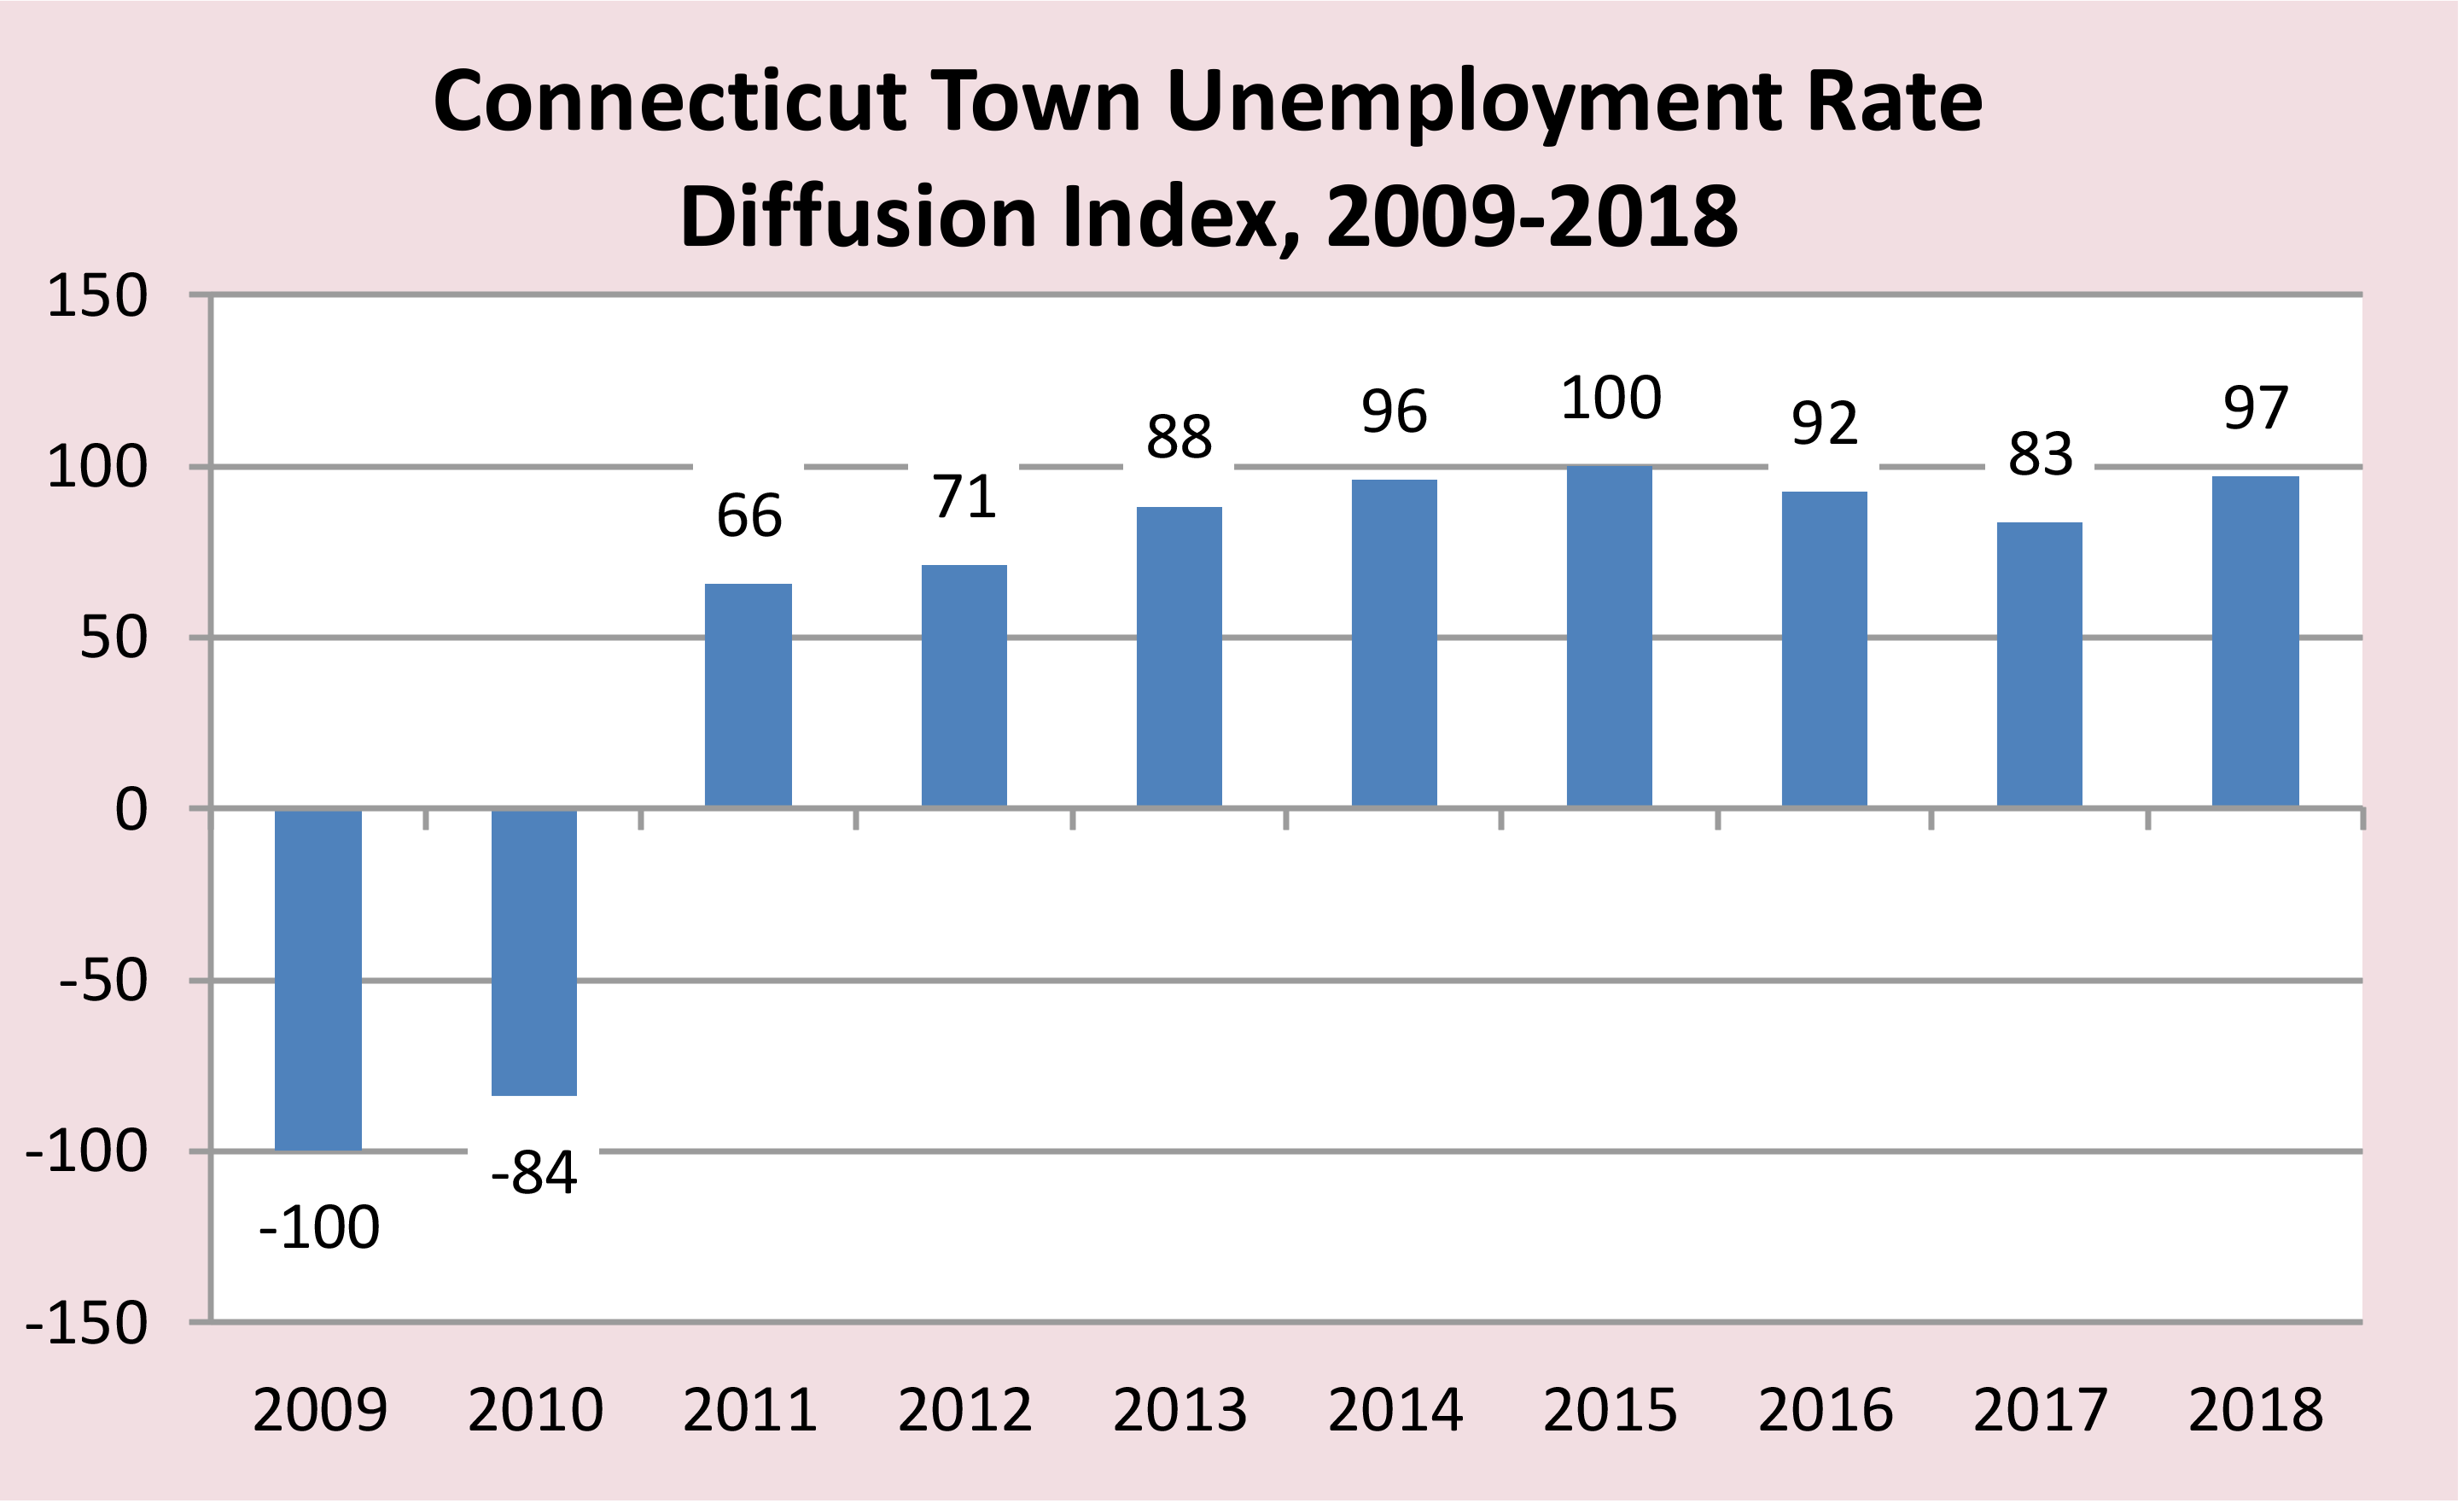
The Town Unemployment Rate Diffusion Index is calculated by subtracting the share of towns that experienced increases in their unemployment rates from the share that had rate decreases over the year.As expected, during 2009-2010, the index values were negative, when Connecticut was in an economic recession. Last year’s diffusion index value of +97 suggests an even better labor market condition across the towns than in 2017. In fact, last year’s index was the highest since the peak in 2015 (chart). If this momentum carries over, 2019’s unemployment situation is poised to remain healthy.


